Immigrants from Fiji vs European In Labor Force | Age 45-54
COMPARE
Immigrants from Fiji
European
In Labor Force | Age 45-54
In Labor Force | Age 45-54 Comparison
Immigrants from Fiji
Europeans
81.5%
IN LABOR FORCE | AGE 45-54
0.1/ 100
METRIC RATING
258th/ 347
METRIC RANK
82.6%
IN LABOR FORCE | AGE 45-54
32.6/ 100
METRIC RATING
184th/ 347
METRIC RANK
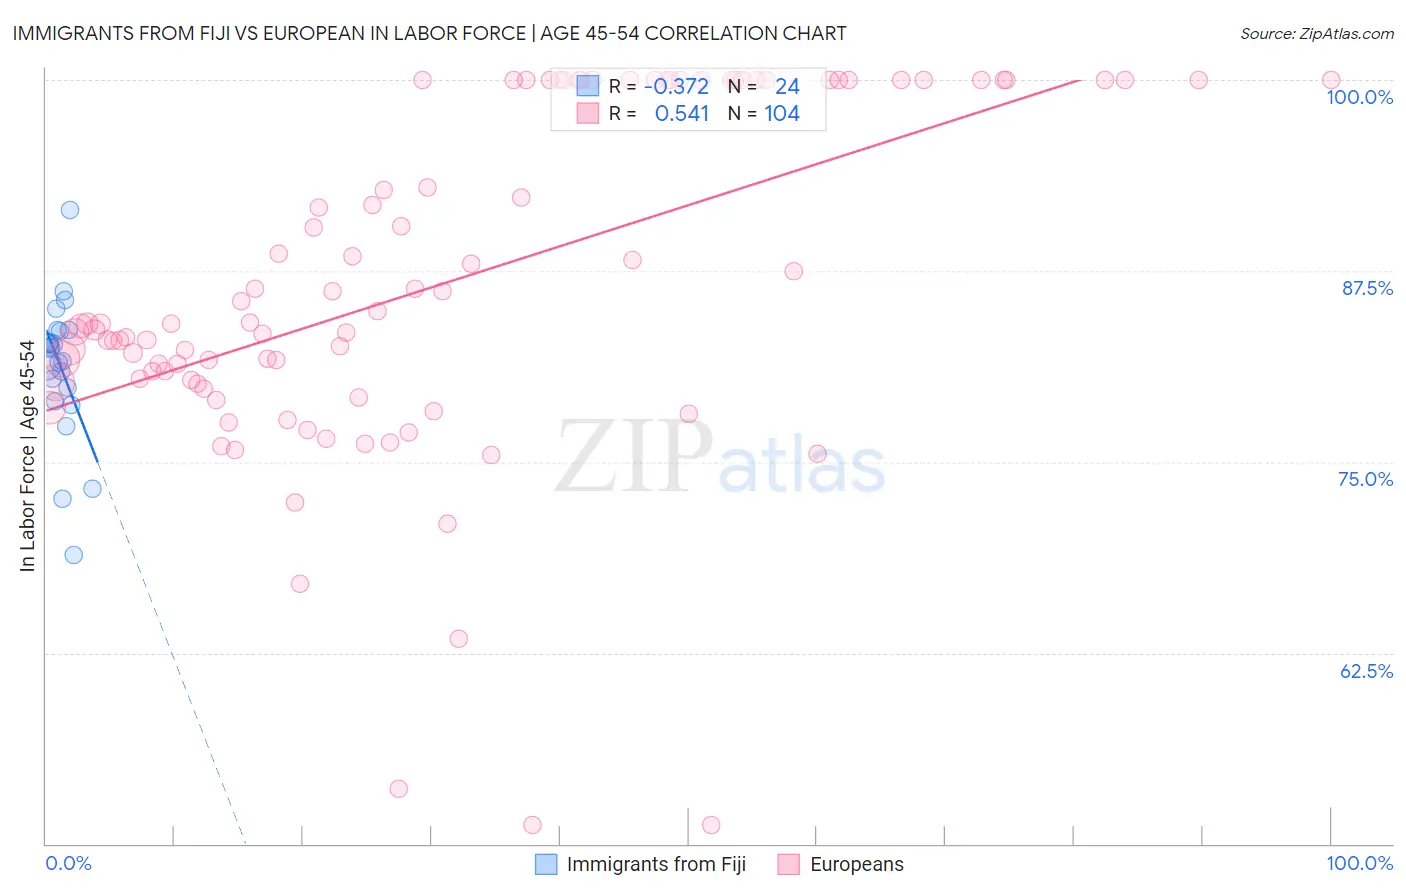
Immigrants from Fiji vs European In Labor Force | Age 45-54 Correlation Chart
The statistical analysis conducted on geographies consisting of 93,754,712 people shows a mild negative correlation between the proportion of Immigrants from Fiji and labor force participation rate among population between the ages 45 and 54 in the United States with a correlation coefficient (R) of -0.372 and weighted average of 81.5%. Similarly, the statistical analysis conducted on geographies consisting of 561,134,108 people shows a substantial positive correlation between the proportion of Europeans and labor force participation rate among population between the ages 45 and 54 in the United States with a correlation coefficient (R) of 0.541 and weighted average of 82.6%, a difference of 1.3%.
In Labor Force | Age 45-54 Correlation Summary
| Measurement | Immigrants from Fiji | European |
| Minimum | 68.9% | 51.2% |
| Maximum | 91.5% | 100.0% |
| Range | 22.6% | 48.8% |
| Mean | 81.2% | 86.7% |
| Median | 82.0% | 84.1% |
| Interquartile 25% (IQ1) | 79.5% | 80.3% |
| Interquartile 75% (IQ3) | 83.6% | 100.0% |
| Interquartile Range (IQR) | 4.1% | 19.7% |
| Standard Deviation (Sample) | 4.7% | 11.2% |
| Standard Deviation (Population) | 4.6% | 11.2% |
Similar Demographics by In Labor Force | Age 45-54
Demographics Similar to Immigrants from Fiji by In Labor Force | Age 45-54
In terms of in labor force | age 45-54, the demographic groups most similar to Immigrants from Fiji are Immigrants from Congo (81.6%, a difference of 0.010%), Guyanese (81.5%, a difference of 0.010%), Barbadian (81.6%, a difference of 0.030%), Spaniard (81.5%, a difference of 0.030%), and Hawaiian (81.5%, a difference of 0.050%).
| Demographics | Rating | Rank | In Labor Force | Age 45-54 |
| Guamanians/Chamorros | 0.2 /100 | #251 | Tragic 81.6% |
| Pennsylvania Germans | 0.2 /100 | #252 | Tragic 81.6% |
| Japanese | 0.2 /100 | #253 | Tragic 81.6% |
| Immigrants | Laos | 0.2 /100 | #254 | Tragic 81.6% |
| Scotch-Irish | 0.2 /100 | #255 | Tragic 81.6% |
| Barbadians | 0.1 /100 | #256 | Tragic 81.6% |
| Immigrants | Congo | 0.1 /100 | #257 | Tragic 81.6% |
| Immigrants | Fiji | 0.1 /100 | #258 | Tragic 81.5% |
| Guyanese | 0.1 /100 | #259 | Tragic 81.5% |
| Spaniards | 0.1 /100 | #260 | Tragic 81.5% |
| Hawaiians | 0.1 /100 | #261 | Tragic 81.5% |
| Immigrants | Guyana | 0.1 /100 | #262 | Tragic 81.5% |
| Indonesians | 0.1 /100 | #263 | Tragic 81.5% |
| Immigrants | West Indies | 0.1 /100 | #264 | Tragic 81.5% |
| Hondurans | 0.1 /100 | #265 | Tragic 81.4% |
Demographics Similar to Europeans by In Labor Force | Age 45-54
In terms of in labor force | age 45-54, the demographic groups most similar to Europeans are New Zealander (82.6%, a difference of 0.0%), Immigrants from England (82.6%, a difference of 0.0%), Immigrants from Hungary (82.7%, a difference of 0.040%), Irish (82.6%, a difference of 0.040%), and Hungarian (82.7%, a difference of 0.050%).
| Demographics | Rating | Rank | In Labor Force | Age 45-54 |
| Immigrants | Nicaragua | 44.6 /100 | #177 | Average 82.7% |
| Nigerians | 40.5 /100 | #178 | Average 82.7% |
| Immigrants | Switzerland | 39.4 /100 | #179 | Fair 82.7% |
| Hungarians | 38.0 /100 | #180 | Fair 82.7% |
| Israelis | 37.7 /100 | #181 | Fair 82.7% |
| Immigrants | Hungary | 37.1 /100 | #182 | Fair 82.7% |
| New Zealanders | 32.7 /100 | #183 | Fair 82.6% |
| Europeans | 32.6 /100 | #184 | Fair 82.6% |
| Immigrants | England | 32.2 /100 | #185 | Fair 82.6% |
| Irish | 29.2 /100 | #186 | Fair 82.6% |
| Immigrants | Costa Rica | 28.3 /100 | #187 | Fair 82.6% |
| South Africans | 28.0 /100 | #188 | Fair 82.6% |
| Syrians | 26.0 /100 | #189 | Fair 82.6% |
| British | 25.7 /100 | #190 | Fair 82.6% |
| Armenians | 23.2 /100 | #191 | Fair 82.5% |