Immigrants from Fiji vs European Unemployment Among Women with Children Under 6 years
COMPARE
Immigrants from Fiji
European
Unemployment Among Women with Children Under 6 years
Unemployment Among Women with Children Under 6 years Comparison
Immigrants from Fiji
Europeans
7.1%
UNEMPLOYMENT AMONG WOMEN WITH CHILDREN UNDER 6 YEARS
98.9/ 100
METRIC RATING
79th/ 347
METRIC RANK
7.5%
UNEMPLOYMENT AMONG WOMEN WITH CHILDREN UNDER 6 YEARS
79.1/ 100
METRIC RATING
144th/ 347
METRIC RANK
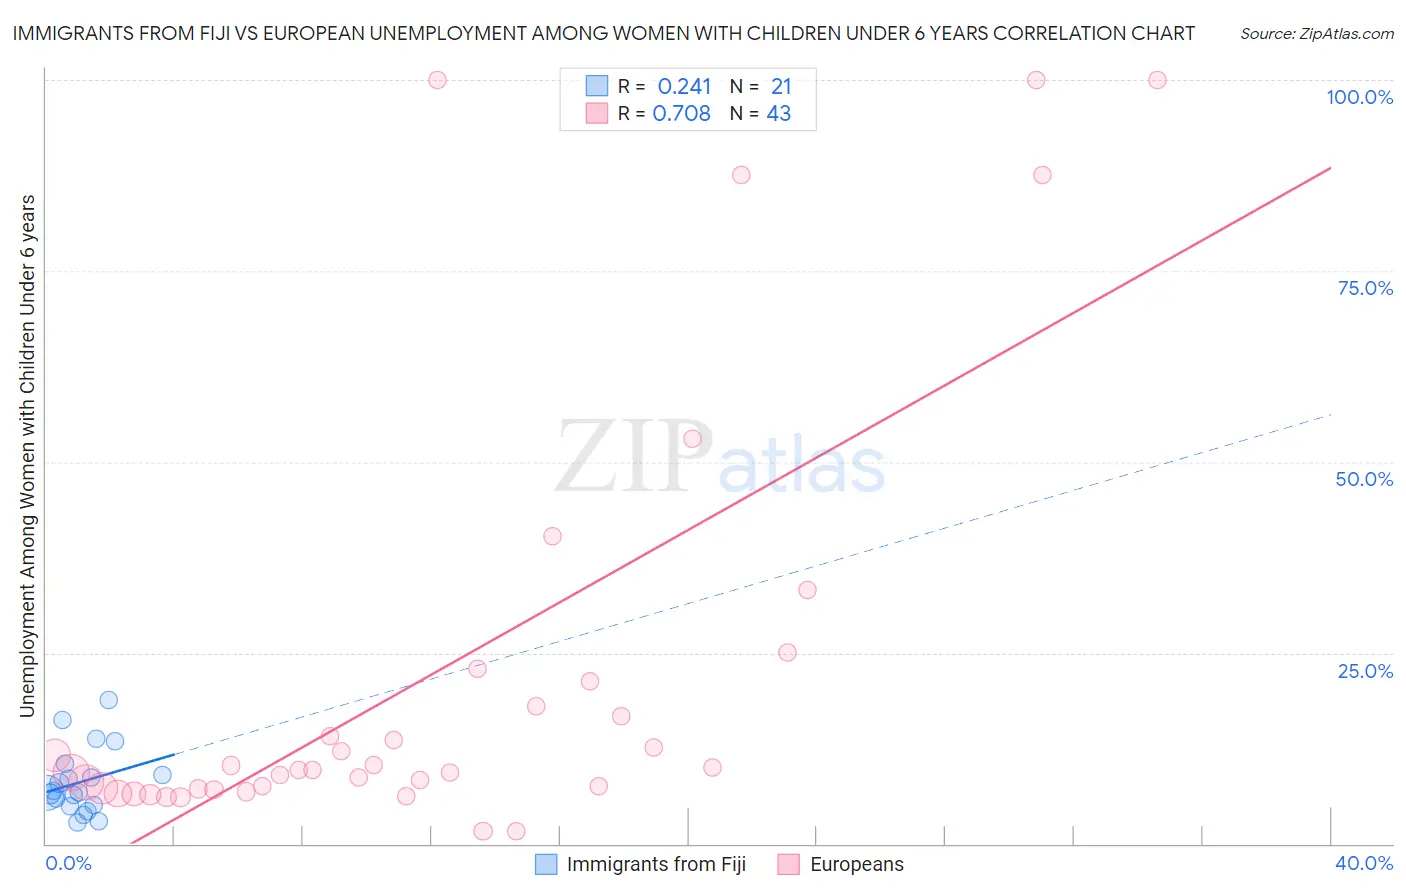
Immigrants from Fiji vs European Unemployment Among Women with Children Under 6 years Correlation Chart
The statistical analysis conducted on geographies consisting of 86,922,643 people shows a weak positive correlation between the proportion of Immigrants from Fiji and unemployment rate among women with children under the age of 6 in the United States with a correlation coefficient (R) of 0.241 and weighted average of 7.1%. Similarly, the statistical analysis conducted on geographies consisting of 373,796,312 people shows a strong positive correlation between the proportion of Europeans and unemployment rate among women with children under the age of 6 in the United States with a correlation coefficient (R) of 0.708 and weighted average of 7.5%, a difference of 5.6%.
Unemployment Among Women with Children Under 6 years Correlation Summary
| Measurement | Immigrants from Fiji | European |
| Minimum | 2.8% | 1.6% |
| Maximum | 18.8% | 100.0% |
| Range | 16.0% | 98.4% |
| Mean | 8.1% | 22.3% |
| Median | 6.7% | 9.7% |
| Interquartile 25% (IQ1) | 5.1% | 7.2% |
| Interquartile 75% (IQ3) | 9.7% | 21.3% |
| Interquartile Range (IQR) | 4.7% | 14.1% |
| Standard Deviation (Sample) | 4.3% | 28.5% |
| Standard Deviation (Population) | 4.2% | 28.2% |
Similar Demographics by Unemployment Among Women with Children Under 6 years
Demographics Similar to Immigrants from Fiji by Unemployment Among Women with Children Under 6 years
In terms of unemployment among women with children under 6 years, the demographic groups most similar to Immigrants from Fiji are Immigrants from Greece (7.1%, a difference of 0.020%), Immigrants from Somalia (7.1%, a difference of 0.050%), Immigrants from Venezuela (7.1%, a difference of 0.060%), Immigrants from Croatia (7.1%, a difference of 0.090%), and Estonian (7.1%, a difference of 0.12%).
| Demographics | Rating | Rank | Unemployment Among Women with Children Under 6 years |
| Cubans | 99.4 /100 | #72 | Exceptional 7.0% |
| Immigrants | Czechoslovakia | 99.2 /100 | #73 | Exceptional 7.0% |
| Turks | 99.2 /100 | #74 | Exceptional 7.0% |
| Immigrants | Eastern Europe | 99.0 /100 | #75 | Exceptional 7.1% |
| Estonians | 99.0 /100 | #76 | Exceptional 7.1% |
| Immigrants | Croatia | 98.9 /100 | #77 | Exceptional 7.1% |
| Immigrants | Somalia | 98.9 /100 | #78 | Exceptional 7.1% |
| Immigrants | Fiji | 98.9 /100 | #79 | Exceptional 7.1% |
| Immigrants | Greece | 98.9 /100 | #80 | Exceptional 7.1% |
| Immigrants | Venezuela | 98.8 /100 | #81 | Exceptional 7.1% |
| Immigrants | Afghanistan | 98.7 /100 | #82 | Exceptional 7.1% |
| Egyptians | 98.7 /100 | #83 | Exceptional 7.1% |
| Immigrants | Albania | 98.7 /100 | #84 | Exceptional 7.1% |
| Immigrants | Romania | 98.7 /100 | #85 | Exceptional 7.1% |
| Immigrants | Zimbabwe | 98.6 /100 | #86 | Exceptional 7.1% |
Demographics Similar to Europeans by Unemployment Among Women with Children Under 6 years
In terms of unemployment among women with children under 6 years, the demographic groups most similar to Europeans are Immigrants from Jordan (7.5%, a difference of 0.030%), Japanese (7.5%, a difference of 0.030%), Immigrants from Oceania (7.5%, a difference of 0.070%), Immigrants from Brazil (7.5%, a difference of 0.18%), and Korean (7.5%, a difference of 0.24%).
| Demographics | Rating | Rank | Unemployment Among Women with Children Under 6 years |
| Immigrants | Cambodia | 84.6 /100 | #137 | Excellent 7.4% |
| Immigrants | Norway | 84.1 /100 | #138 | Excellent 7.4% |
| Immigrants | Colombia | 83.9 /100 | #139 | Excellent 7.4% |
| Scandinavians | 83.0 /100 | #140 | Excellent 7.4% |
| Greeks | 82.6 /100 | #141 | Excellent 7.4% |
| Immigrants | Argentina | 81.5 /100 | #142 | Excellent 7.5% |
| Koreans | 81.3 /100 | #143 | Excellent 7.5% |
| Europeans | 79.1 /100 | #144 | Good 7.5% |
| Immigrants | Jordan | 78.9 /100 | #145 | Good 7.5% |
| Japanese | 78.9 /100 | #146 | Good 7.5% |
| Immigrants | Oceania | 78.4 /100 | #147 | Good 7.5% |
| Immigrants | Brazil | 77.3 /100 | #148 | Good 7.5% |
| Colombians | 76.1 /100 | #149 | Good 7.5% |
| Aleuts | 76.0 /100 | #150 | Good 7.5% |
| Immigrants | Peru | 74.9 /100 | #151 | Good 7.5% |