Spaniard vs European Receiving Food Stamps
COMPARE
Spaniard
European
Receiving Food Stamps
Receiving Food Stamps Comparison
Spaniards
Europeans
11.9%
RECEIVING FOOD STAMPS
39.8/ 100
METRIC RATING
184th/ 347
METRIC RANK
9.5%
RECEIVING FOOD STAMPS
99.6/ 100
METRIC RATING
37th/ 347
METRIC RANK
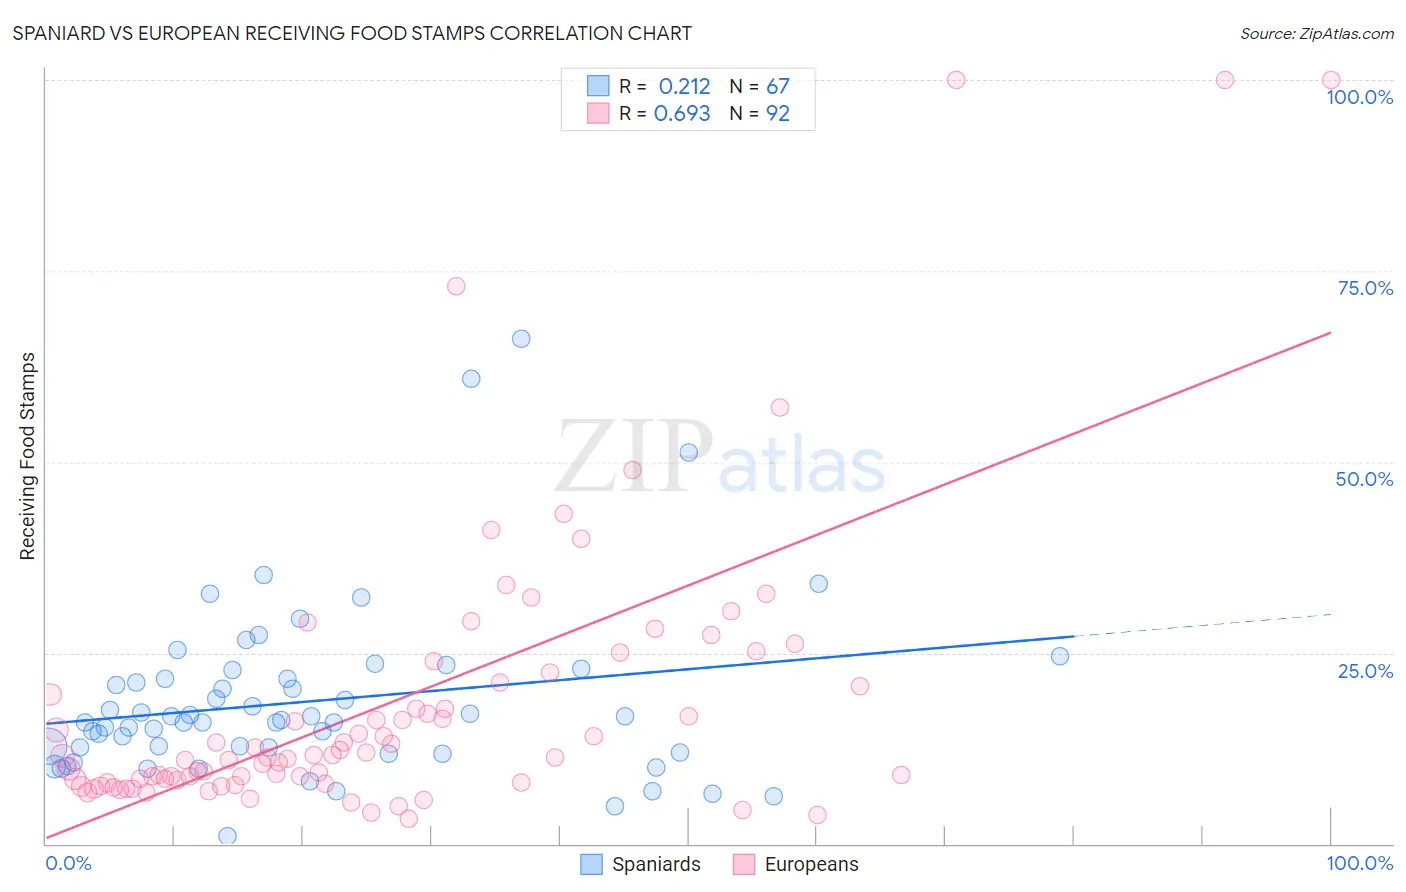
Spaniard vs European Receiving Food Stamps Correlation Chart
The statistical analysis conducted on geographies consisting of 442,043,399 people shows a weak positive correlation between the proportion of Spaniards and percentage of population receiving government assistance and/or food stamps in the United States with a correlation coefficient (R) of 0.212 and weighted average of 11.9%. Similarly, the statistical analysis conducted on geographies consisting of 558,520,577 people shows a significant positive correlation between the proportion of Europeans and percentage of population receiving government assistance and/or food stamps in the United States with a correlation coefficient (R) of 0.693 and weighted average of 9.5%, a difference of 25.4%.
Receiving Food Stamps Correlation Summary
| Measurement | Spaniard | European |
| Minimum | 1.0% | 3.2% |
| Maximum | 66.1% | 100.0% |
| Range | 65.1% | 96.8% |
| Mean | 18.6% | 18.5% |
| Median | 15.9% | 11.4% |
| Interquartile 25% (IQ1) | 12.0% | 8.2% |
| Interquartile 75% (IQ3) | 21.6% | 20.8% |
| Interquartile Range (IQR) | 9.6% | 12.6% |
| Standard Deviation (Sample) | 11.4% | 19.3% |
| Standard Deviation (Population) | 11.4% | 19.2% |
Similar Demographics by Receiving Food Stamps
Demographics Similar to Spaniards by Receiving Food Stamps
In terms of receiving food stamps, the demographic groups most similar to Spaniards are Immigrants from Uganda (11.9%, a difference of 0.080%), Immigrants from Morocco (11.9%, a difference of 0.13%), South American Indian (11.9%, a difference of 0.28%), Immigrants from Iraq (12.0%, a difference of 0.38%), and Spanish (12.0%, a difference of 0.42%).
| Demographics | Rating | Rank | Receiving Food Stamps |
| Immigrants | Ukraine | 48.4 /100 | #177 | Average 11.8% |
| German Russians | 48.1 /100 | #178 | Average 11.8% |
| Immigrants | Kenya | 46.4 /100 | #179 | Average 11.8% |
| Uruguayans | 44.8 /100 | #180 | Average 11.8% |
| South American Indians | 41.7 /100 | #181 | Average 11.9% |
| Immigrants | Morocco | 40.7 /100 | #182 | Average 11.9% |
| Immigrants | Uganda | 40.3 /100 | #183 | Average 11.9% |
| Spaniards | 39.8 /100 | #184 | Fair 11.9% |
| Immigrants | Iraq | 37.1 /100 | #185 | Fair 12.0% |
| Spanish | 36.9 /100 | #186 | Fair 12.0% |
| Albanians | 35.4 /100 | #187 | Fair 12.0% |
| Sudanese | 33.4 /100 | #188 | Fair 12.0% |
| Immigrants | Cameroon | 32.5 /100 | #189 | Fair 12.0% |
| Immigrants | Peru | 32.2 /100 | #190 | Fair 12.0% |
| Venezuelans | 32.1 /100 | #191 | Fair 12.0% |
Demographics Similar to Europeans by Receiving Food Stamps
In terms of receiving food stamps, the demographic groups most similar to Europeans are Estonian (9.5%, a difference of 0.070%), Immigrants from Austria (9.5%, a difference of 0.090%), Turkish (9.5%, a difference of 0.12%), Zimbabwean (9.5%, a difference of 0.13%), and Immigrants from Sri Lanka (9.5%, a difference of 0.29%).
| Demographics | Rating | Rank | Receiving Food Stamps |
| Immigrants | Sweden | 99.7 /100 | #30 | Exceptional 9.3% |
| Immigrants | Eastern Asia | 99.7 /100 | #31 | Exceptional 9.3% |
| Bolivians | 99.7 /100 | #32 | Exceptional 9.3% |
| Zimbabweans | 99.6 /100 | #33 | Exceptional 9.5% |
| Turks | 99.6 /100 | #34 | Exceptional 9.5% |
| Immigrants | Austria | 99.6 /100 | #35 | Exceptional 9.5% |
| Estonians | 99.6 /100 | #36 | Exceptional 9.5% |
| Europeans | 99.6 /100 | #37 | Exceptional 9.5% |
| Immigrants | Sri Lanka | 99.5 /100 | #38 | Exceptional 9.5% |
| Immigrants | Bolivia | 99.5 /100 | #39 | Exceptional 9.5% |
| Immigrants | Netherlands | 99.5 /100 | #40 | Exceptional 9.5% |
| Cambodians | 99.5 /100 | #41 | Exceptional 9.5% |
| Immigrants | China | 99.5 /100 | #42 | Exceptional 9.6% |
| Croatians | 99.5 /100 | #43 | Exceptional 9.6% |
| Immigrants | Denmark | 99.4 /100 | #44 | Exceptional 9.6% |