Immigrants from Fiji vs Yaqui Single Mother Poverty
COMPARE
Immigrants from Fiji
Yaqui
Single Mother Poverty
Single Mother Poverty Comparison
Immigrants from Fiji
Yaqui
26.6%
SINGLE MOTHER POVERTY
99.9/ 100
METRIC RATING
38th/ 347
METRIC RANK
33.1%
SINGLE MOTHER POVERTY
0.0/ 100
METRIC RATING
295th/ 347
METRIC RANK
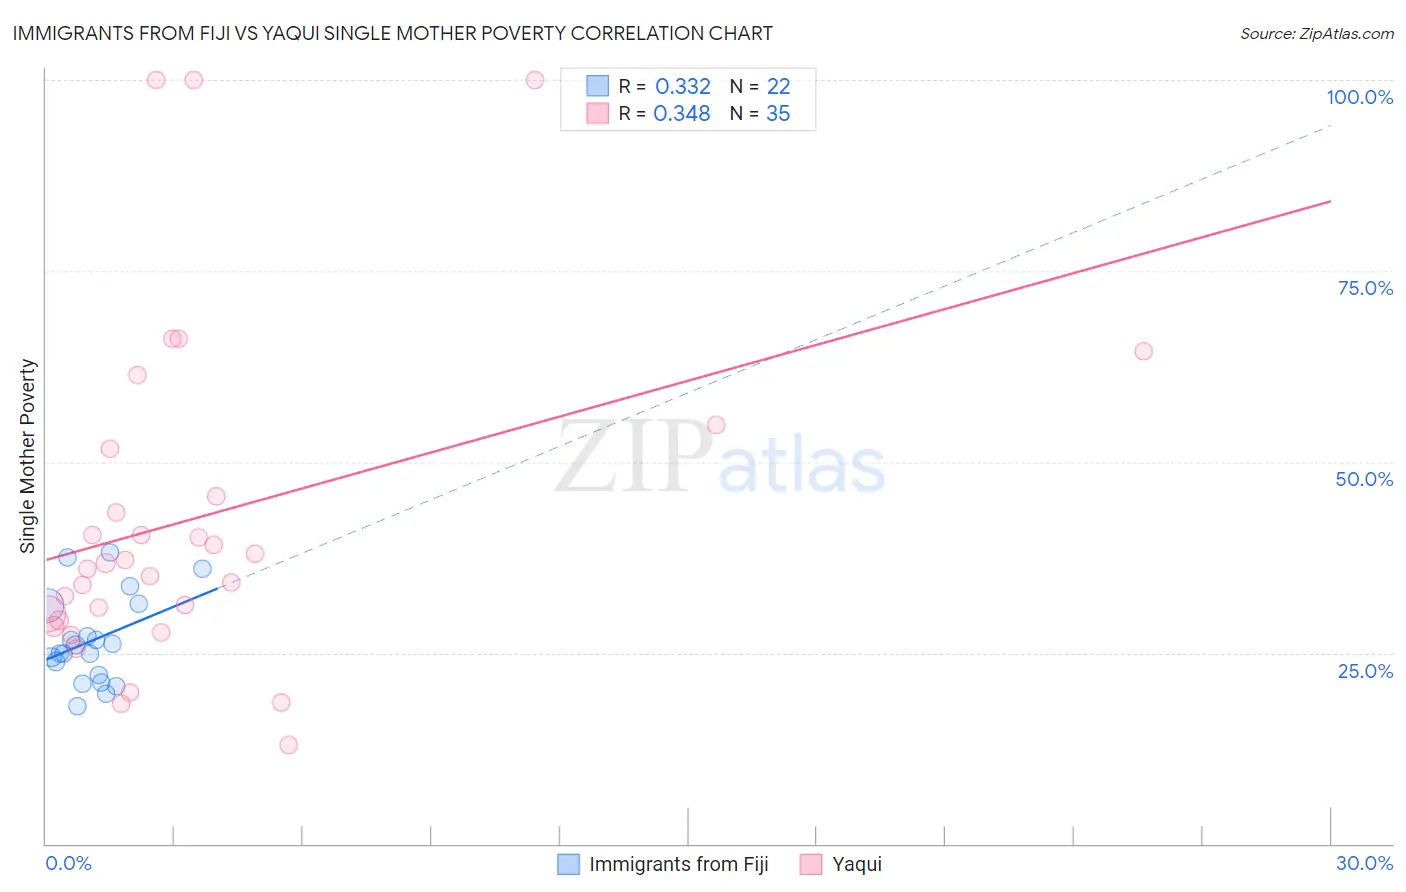
Immigrants from Fiji vs Yaqui Single Mother Poverty Correlation Chart
The statistical analysis conducted on geographies consisting of 93,178,948 people shows a mild positive correlation between the proportion of Immigrants from Fiji and poverty level among single mothers in the United States with a correlation coefficient (R) of 0.332 and weighted average of 26.6%. Similarly, the statistical analysis conducted on geographies consisting of 106,870,477 people shows a mild positive correlation between the proportion of Yaqui and poverty level among single mothers in the United States with a correlation coefficient (R) of 0.348 and weighted average of 33.1%, a difference of 24.5%.
Single Mother Poverty Correlation Summary
| Measurement | Immigrants from Fiji | Yaqui |
| Minimum | 18.0% | 12.9% |
| Maximum | 38.1% | 100.0% |
| Range | 20.1% | 87.1% |
| Mean | 26.6% | 42.8% |
| Median | 25.5% | 36.7% |
| Interquartile 25% (IQ1) | 22.0% | 29.3% |
| Interquartile 75% (IQ3) | 31.2% | 51.8% |
| Interquartile Range (IQR) | 9.2% | 22.5% |
| Standard Deviation (Sample) | 5.8% | 22.1% |
| Standard Deviation (Population) | 5.6% | 21.8% |
Similar Demographics by Single Mother Poverty
Demographics Similar to Immigrants from Fiji by Single Mother Poverty
In terms of single mother poverty, the demographic groups most similar to Immigrants from Fiji are Okinawan (26.6%, a difference of 0.040%), Immigrants from Israel (26.6%, a difference of 0.040%), Maltese (26.6%, a difference of 0.090%), Immigrants from Indonesia (26.6%, a difference of 0.21%), and Bulgarian (26.5%, a difference of 0.22%).
| Demographics | Rating | Rank | Single Mother Poverty |
| Immigrants | Philippines | 100.0 /100 | #31 | Exceptional 26.5% |
| Tongans | 99.9 /100 | #32 | Exceptional 26.5% |
| Bulgarians | 99.9 /100 | #33 | Exceptional 26.5% |
| Immigrants | Indonesia | 99.9 /100 | #34 | Exceptional 26.6% |
| Maltese | 99.9 /100 | #35 | Exceptional 26.6% |
| Okinawans | 99.9 /100 | #36 | Exceptional 26.6% |
| Immigrants | Israel | 99.9 /100 | #37 | Exceptional 26.6% |
| Immigrants | Fiji | 99.9 /100 | #38 | Exceptional 26.6% |
| Sri Lankans | 99.9 /100 | #39 | Exceptional 26.7% |
| Immigrants | Vietnam | 99.9 /100 | #40 | Exceptional 26.7% |
| Immigrants | Greece | 99.9 /100 | #41 | Exceptional 26.7% |
| Armenians | 99.9 /100 | #42 | Exceptional 26.8% |
| Tsimshian | 99.9 /100 | #43 | Exceptional 26.8% |
| Immigrants | Sierra Leone | 99.9 /100 | #44 | Exceptional 26.9% |
| Latvians | 99.9 /100 | #45 | Exceptional 26.9% |
Demographics Similar to Yaqui by Single Mother Poverty
In terms of single mother poverty, the demographic groups most similar to Yaqui are French American Indian (33.1%, a difference of 0.030%), Blackfeet (33.2%, a difference of 0.16%), Pennsylvania German (33.2%, a difference of 0.30%), African (33.3%, a difference of 0.41%), and Immigrants from Guatemala (33.3%, a difference of 0.50%).
| Demographics | Rating | Rank | Single Mother Poverty |
| Somalis | 0.0 /100 | #288 | Tragic 32.6% |
| U.S. Virgin Islanders | 0.0 /100 | #289 | Tragic 32.6% |
| Osage | 0.0 /100 | #290 | Tragic 32.6% |
| Guatemalans | 0.0 /100 | #291 | Tragic 32.9% |
| Shoshone | 0.0 /100 | #292 | Tragic 32.9% |
| Aleuts | 0.0 /100 | #293 | Tragic 32.9% |
| French American Indians | 0.0 /100 | #294 | Tragic 33.1% |
| Yaqui | 0.0 /100 | #295 | Tragic 33.1% |
| Blackfeet | 0.0 /100 | #296 | Tragic 33.2% |
| Pennsylvania Germans | 0.0 /100 | #297 | Tragic 33.2% |
| Africans | 0.0 /100 | #298 | Tragic 33.3% |
| Immigrants | Guatemala | 0.0 /100 | #299 | Tragic 33.3% |
| Hispanics or Latinos | 0.0 /100 | #300 | Tragic 33.3% |
| Immigrants | Somalia | 0.0 /100 | #301 | Tragic 33.4% |
| Arapaho | 0.0 /100 | #302 | Tragic 33.4% |