Immigrants from Ethiopia vs Bolivian Family Poverty
COMPARE
Immigrants from Ethiopia
Bolivian
Family Poverty
Family Poverty Comparison
Immigrants from Ethiopia
Bolivians
8.9%
FAMILY POVERTY
62.5/ 100
METRIC RATING
167th/ 347
METRIC RANK
7.5%
FAMILY POVERTY
99.3/ 100
METRIC RATING
38th/ 347
METRIC RANK
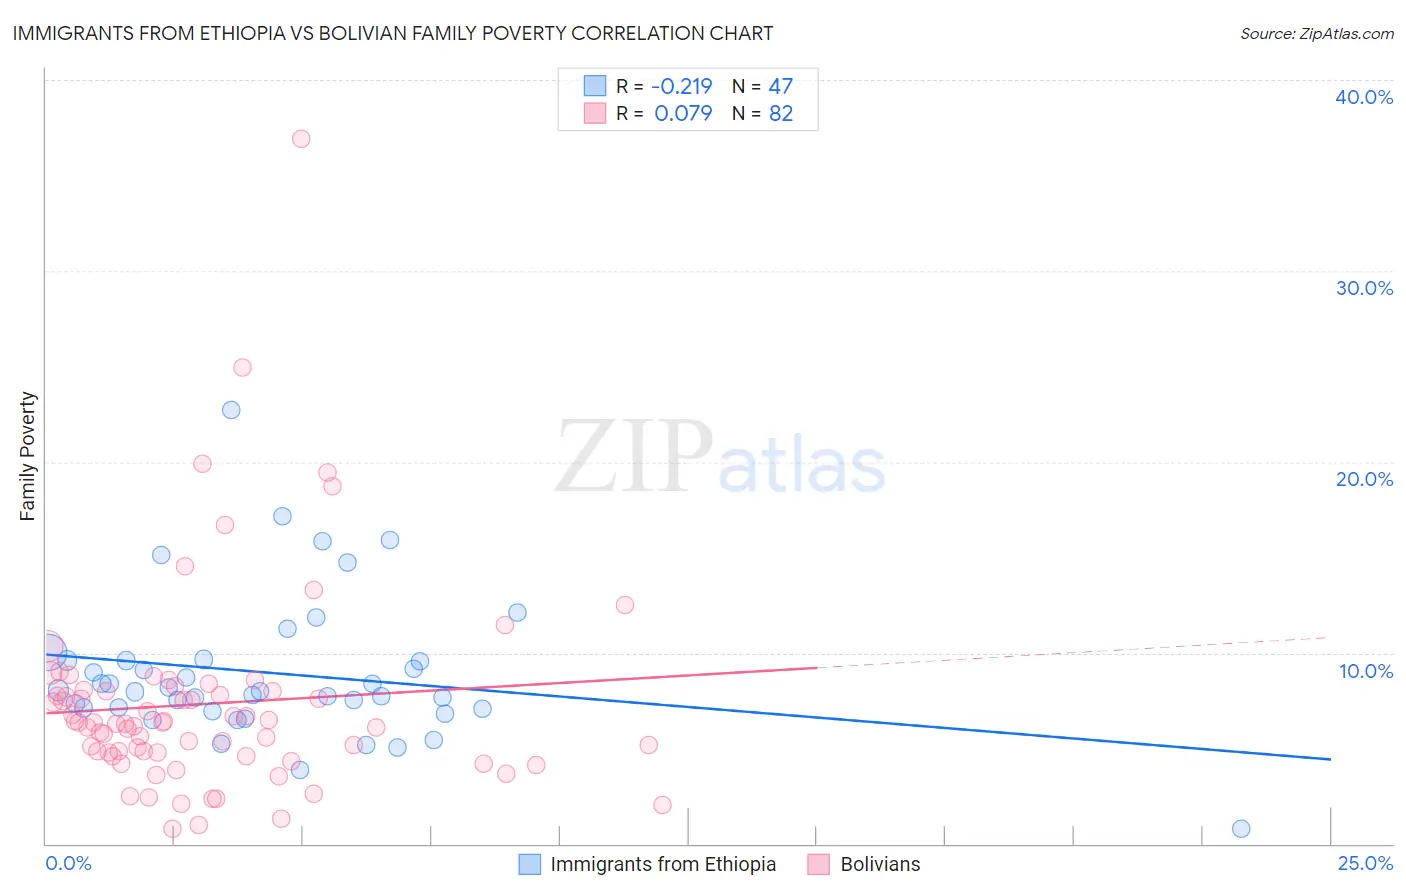
Immigrants from Ethiopia vs Bolivian Family Poverty Correlation Chart
The statistical analysis conducted on geographies consisting of 211,298,755 people shows a weak negative correlation between the proportion of Immigrants from Ethiopia and poverty level among families in the United States with a correlation coefficient (R) of -0.219 and weighted average of 8.9%. Similarly, the statistical analysis conducted on geographies consisting of 184,453,114 people shows a slight positive correlation between the proportion of Bolivians and poverty level among families in the United States with a correlation coefficient (R) of 0.079 and weighted average of 7.5%, a difference of 17.5%.
Family Poverty Correlation Summary
| Measurement | Immigrants from Ethiopia | Bolivian |
| Minimum | 0.78% | 0.79% |
| Maximum | 22.7% | 36.9% |
| Range | 22.0% | 36.2% |
| Mean | 8.9% | 7.3% |
| Median | 8.0% | 6.3% |
| Interquartile 25% (IQ1) | 7.1% | 4.8% |
| Interquartile 75% (IQ3) | 9.6% | 8.0% |
| Interquartile Range (IQR) | 2.5% | 3.2% |
| Standard Deviation (Sample) | 3.8% | 5.4% |
| Standard Deviation (Population) | 3.7% | 5.4% |
Similar Demographics by Family Poverty
Demographics Similar to Immigrants from Ethiopia by Family Poverty
In terms of family poverty, the demographic groups most similar to Immigrants from Ethiopia are Israeli (8.9%, a difference of 0.060%), Afghan (8.8%, a difference of 0.14%), Guamanian/Chamorro (8.8%, a difference of 0.32%), Celtic (8.8%, a difference of 0.35%), and Immigrants from Chile (8.9%, a difference of 0.41%).
| Demographics | Rating | Rank | Family Poverty |
| Hungarians | 67.2 /100 | #160 | Good 8.8% |
| Immigrants | Northern Africa | 66.9 /100 | #161 | Good 8.8% |
| Ethiopians | 66.3 /100 | #162 | Good 8.8% |
| Pennsylvania Germans | 66.0 /100 | #163 | Good 8.8% |
| Celtics | 64.9 /100 | #164 | Good 8.8% |
| Guamanians/Chamorros | 64.7 /100 | #165 | Good 8.8% |
| Afghans | 63.5 /100 | #166 | Good 8.8% |
| Immigrants | Ethiopia | 62.5 /100 | #167 | Good 8.9% |
| Israelis | 62.1 /100 | #168 | Good 8.9% |
| Immigrants | Chile | 59.6 /100 | #169 | Average 8.9% |
| Kenyans | 58.2 /100 | #170 | Average 8.9% |
| Lebanese | 57.6 /100 | #171 | Average 8.9% |
| Immigrants | Peru | 57.5 /100 | #172 | Average 8.9% |
| Immigrants | Fiji | 56.4 /100 | #173 | Average 8.9% |
| Immigrants | Albania | 50.0 /100 | #174 | Average 9.0% |
Demographics Similar to Bolivians by Family Poverty
In terms of family poverty, the demographic groups most similar to Bolivians are Carpatho Rusyn (7.5%, a difference of 0.060%), Slovene (7.5%, a difference of 0.10%), Estonian (7.5%, a difference of 0.24%), Immigrants from Australia (7.6%, a difference of 0.40%), and Turkish (7.5%, a difference of 0.41%).
| Demographics | Rating | Rank | Family Poverty |
| Czechs | 99.6 /100 | #31 | Exceptional 7.4% |
| Poles | 99.5 /100 | #32 | Exceptional 7.4% |
| Immigrants | Japan | 99.5 /100 | #33 | Exceptional 7.4% |
| Russians | 99.5 /100 | #34 | Exceptional 7.5% |
| Greeks | 99.4 /100 | #35 | Exceptional 7.5% |
| Turks | 99.4 /100 | #36 | Exceptional 7.5% |
| Estonians | 99.4 /100 | #37 | Exceptional 7.5% |
| Bolivians | 99.3 /100 | #38 | Exceptional 7.5% |
| Carpatho Rusyns | 99.3 /100 | #39 | Exceptional 7.5% |
| Slovenes | 99.3 /100 | #40 | Exceptional 7.5% |
| Immigrants | Australia | 99.2 /100 | #41 | Exceptional 7.6% |
| Scandinavians | 99.1 /100 | #42 | Exceptional 7.6% |
| Immigrants | Austria | 99.1 /100 | #43 | Exceptional 7.6% |
| Germans | 99.0 /100 | #44 | Exceptional 7.7% |
| Okinawans | 98.9 /100 | #45 | Exceptional 7.7% |