Immigrants from Eritrea vs Pennsylvania German Single Male Poverty
COMPARE
Immigrants from Eritrea
Pennsylvania German
Single Male Poverty
Single Male Poverty Comparison
Immigrants from Eritrea
Pennsylvania Germans
12.1%
SINGLE MALE POVERTY
98.5/ 100
METRIC RATING
88th/ 347
METRIC RANK
15.6%
SINGLE MALE POVERTY
0.0/ 100
METRIC RATING
306th/ 347
METRIC RANK
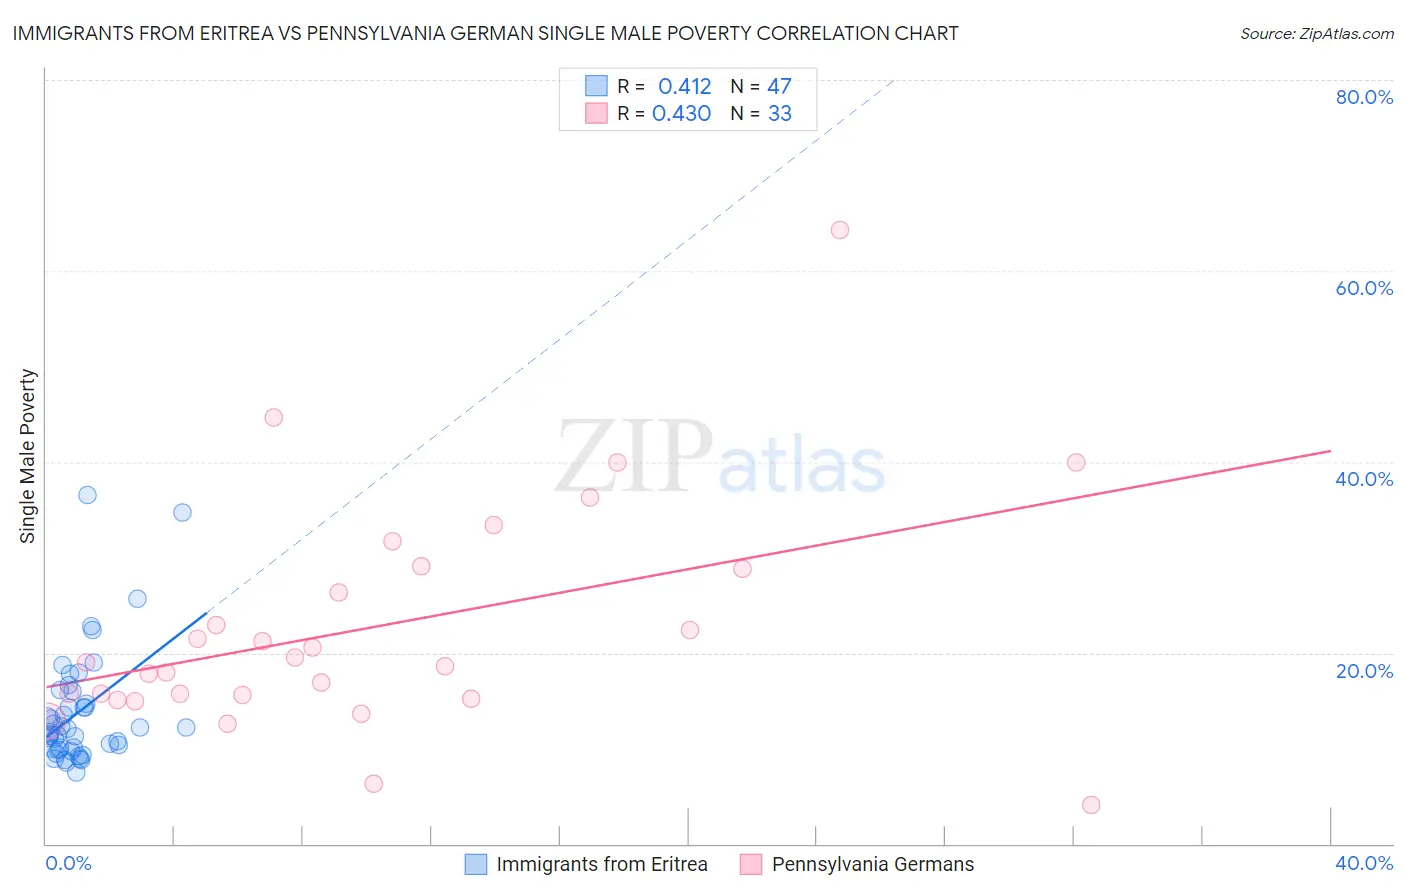
Immigrants from Eritrea vs Pennsylvania German Single Male Poverty Correlation Chart
The statistical analysis conducted on geographies consisting of 101,335,680 people shows a moderate positive correlation between the proportion of Immigrants from Eritrea and poverty level among single males in the United States with a correlation coefficient (R) of 0.412 and weighted average of 12.1%. Similarly, the statistical analysis conducted on geographies consisting of 211,597,863 people shows a moderate positive correlation between the proportion of Pennsylvania Germans and poverty level among single males in the United States with a correlation coefficient (R) of 0.430 and weighted average of 15.6%, a difference of 28.6%.
Single Male Poverty Correlation Summary
| Measurement | Immigrants from Eritrea | Pennsylvania German |
| Minimum | 7.5% | 4.0% |
| Maximum | 36.5% | 64.3% |
| Range | 29.0% | 60.3% |
| Mean | 13.9% | 22.7% |
| Median | 12.1% | 19.0% |
| Interquartile 25% (IQ1) | 10.0% | 15.3% |
| Interquartile 75% (IQ3) | 16.0% | 29.0% |
| Interquartile Range (IQR) | 6.0% | 13.6% |
| Standard Deviation (Sample) | 6.1% | 12.1% |
| Standard Deviation (Population) | 6.1% | 11.9% |
Similar Demographics by Single Male Poverty
Demographics Similar to Immigrants from Eritrea by Single Male Poverty
In terms of single male poverty, the demographic groups most similar to Immigrants from Eritrea are South American (12.1%, a difference of 0.0%), Immigrants from Israel (12.1%, a difference of 0.020%), Turkish (12.1%, a difference of 0.040%), Immigrants from Czechoslovakia (12.1%, a difference of 0.11%), and Immigrants from Colombia (12.1%, a difference of 0.14%).
| Demographics | Rating | Rank | Single Male Poverty |
| Immigrants | South America | 98.7 /100 | #81 | Exceptional 12.1% |
| Immigrants | Colombia | 98.6 /100 | #82 | Exceptional 12.1% |
| Immigrants | Chile | 98.6 /100 | #83 | Exceptional 12.1% |
| Immigrants | Czechoslovakia | 98.6 /100 | #84 | Exceptional 12.1% |
| Turks | 98.5 /100 | #85 | Exceptional 12.1% |
| Immigrants | Israel | 98.5 /100 | #86 | Exceptional 12.1% |
| South Americans | 98.5 /100 | #87 | Exceptional 12.1% |
| Immigrants | Eritrea | 98.5 /100 | #88 | Exceptional 12.1% |
| Immigrants | Ireland | 98.3 /100 | #89 | Exceptional 12.1% |
| South American Indians | 98.3 /100 | #90 | Exceptional 12.1% |
| Immigrants | Turkey | 98.2 /100 | #91 | Exceptional 12.1% |
| Spanish American Indians | 98.0 /100 | #92 | Exceptional 12.1% |
| Immigrants | Bosnia and Herzegovina | 97.9 /100 | #93 | Exceptional 12.1% |
| Colombians | 97.8 /100 | #94 | Exceptional 12.2% |
| Mongolians | 97.7 /100 | #95 | Exceptional 12.2% |
Demographics Similar to Pennsylvania Germans by Single Male Poverty
In terms of single male poverty, the demographic groups most similar to Pennsylvania Germans are Blackfeet (15.5%, a difference of 0.43%), Ute (15.7%, a difference of 0.75%), Alaska Native (15.4%, a difference of 0.96%), Aleut (15.4%, a difference of 1.1%), and Potawatomi (15.8%, a difference of 1.3%).
| Demographics | Rating | Rank | Single Male Poverty |
| Delaware | 0.0 /100 | #299 | Tragic 15.0% |
| Cree | 0.0 /100 | #300 | Tragic 15.1% |
| Dominicans | 0.0 /100 | #301 | Tragic 15.2% |
| Alsatians | 0.0 /100 | #302 | Tragic 15.2% |
| Aleuts | 0.0 /100 | #303 | Tragic 15.4% |
| Alaska Natives | 0.0 /100 | #304 | Tragic 15.4% |
| Blackfeet | 0.0 /100 | #305 | Tragic 15.5% |
| Pennsylvania Germans | 0.0 /100 | #306 | Tragic 15.6% |
| Ute | 0.0 /100 | #307 | Tragic 15.7% |
| Potawatomi | 0.0 /100 | #308 | Tragic 15.8% |
| Americans | 0.0 /100 | #309 | Tragic 15.8% |
| Yakama | 0.0 /100 | #310 | Tragic 15.9% |
| Seminole | 0.0 /100 | #311 | Tragic 16.0% |
| Comanche | 0.0 /100 | #312 | Tragic 16.0% |
| Cherokee | 0.0 /100 | #313 | Tragic 16.1% |