Immigrants from Eritrea vs Peruvian Unemployment Among Women with Children Under 18 years
COMPARE
Immigrants from Eritrea
Peruvian
Unemployment Among Women with Children Under 18 years
Unemployment Among Women with Children Under 18 years Comparison
Immigrants from Eritrea
Peruvians
5.5%
UNEMPLOYMENT AMONG WOMEN WITH CHILDREN UNDER 18 YEARS
33.8/ 100
METRIC RATING
189th/ 347
METRIC RANK
5.6%
UNEMPLOYMENT AMONG WOMEN WITH CHILDREN UNDER 18 YEARS
12.1/ 100
METRIC RATING
207th/ 347
METRIC RANK
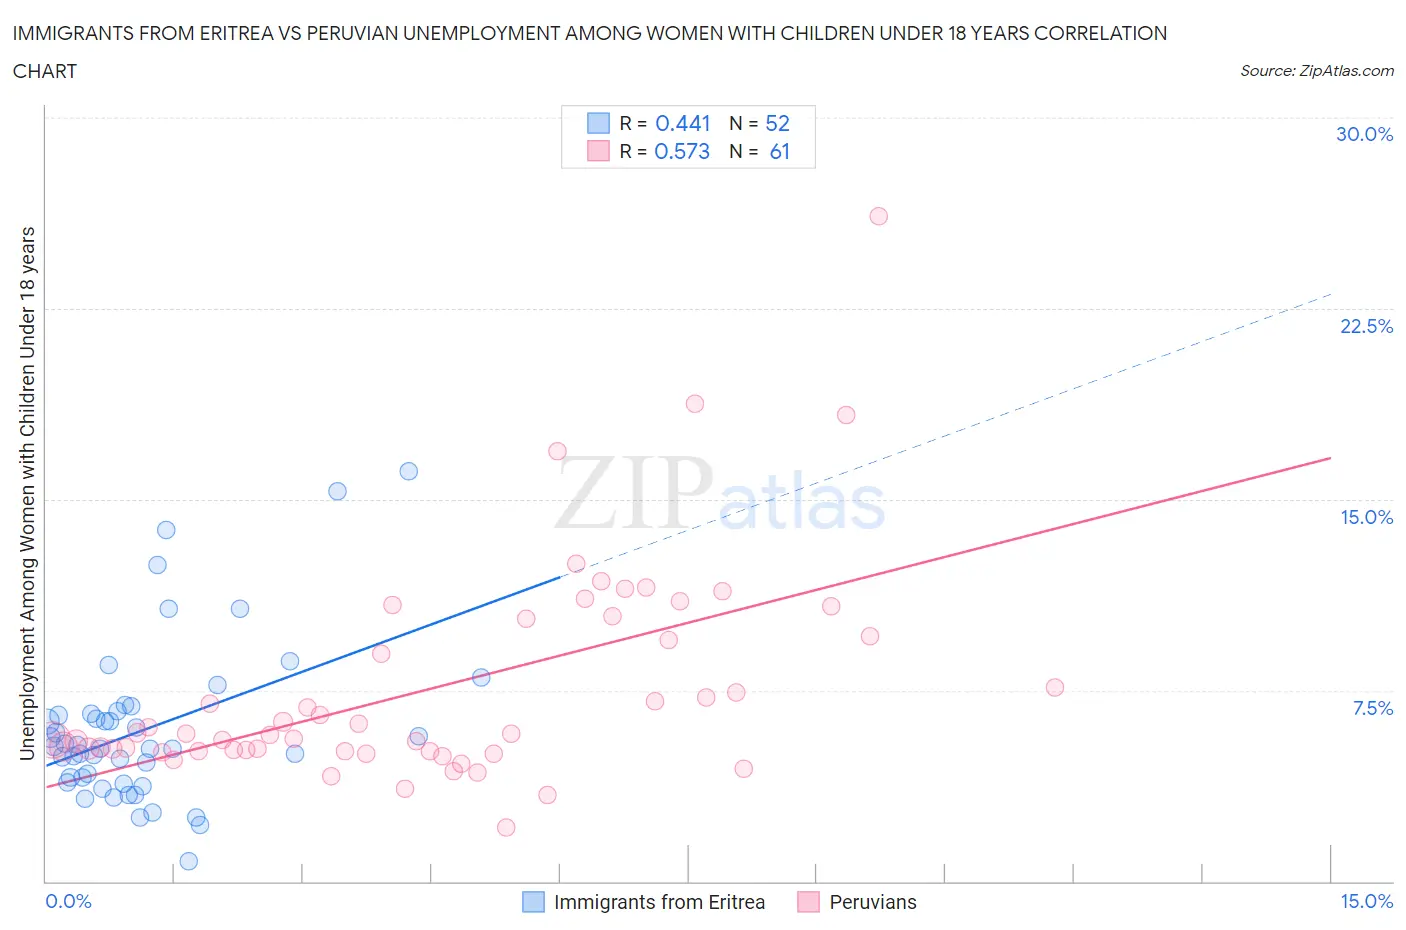
Immigrants from Eritrea vs Peruvian Unemployment Among Women with Children Under 18 years Correlation Chart
The statistical analysis conducted on geographies consisting of 103,960,003 people shows a moderate positive correlation between the proportion of Immigrants from Eritrea and unemployment rate among women with children under the age of 18 in the United States with a correlation coefficient (R) of 0.441 and weighted average of 5.5%. Similarly, the statistical analysis conducted on geographies consisting of 352,151,471 people shows a substantial positive correlation between the proportion of Peruvians and unemployment rate among women with children under the age of 18 in the United States with a correlation coefficient (R) of 0.573 and weighted average of 5.6%, a difference of 2.3%.
Unemployment Among Women with Children Under 18 years Correlation Summary
| Measurement | Immigrants from Eritrea | Peruvian |
| Minimum | 0.80% | 2.1% |
| Maximum | 16.1% | 26.1% |
| Range | 15.3% | 24.0% |
| Mean | 6.0% | 7.6% |
| Median | 5.3% | 5.8% |
| Interquartile 25% (IQ1) | 4.0% | 5.1% |
| Interquartile 75% (IQ3) | 6.6% | 9.9% |
| Interquartile Range (IQR) | 2.7% | 4.8% |
| Standard Deviation (Sample) | 3.2% | 4.3% |
| Standard Deviation (Population) | 3.1% | 4.2% |
Demographics Similar to Immigrants from Eritrea and Peruvians by Unemployment Among Women with Children Under 18 years
In terms of unemployment among women with children under 18 years, the demographic groups most similar to Immigrants from Eritrea are Iraqi (5.5%, a difference of 0.12%), Immigrants from Poland (5.5%, a difference of 0.21%), South American Indian (5.5%, a difference of 0.24%), Immigrants from Spain (5.5%, a difference of 0.25%), and Immigrants from Afghanistan (5.5%, a difference of 0.37%). Similarly, the demographic groups most similar to Peruvians are Nicaraguan (5.6%, a difference of 0.040%), Immigrants from Costa Rica (5.6%, a difference of 0.080%), Tsimshian (5.6%, a difference of 0.46%), Israeli (5.6%, a difference of 0.52%), and Portuguese (5.6%, a difference of 0.55%).
| Demographics | Rating | Rank | Unemployment Among Women with Children Under 18 years |
| Iraqis | 35.3 /100 | #188 | Fair 5.5% |
| Immigrants | Eritrea | 33.8 /100 | #189 | Fair 5.5% |
| Immigrants | Poland | 31.2 /100 | #190 | Fair 5.5% |
| South American Indians | 30.8 /100 | #191 | Fair 5.5% |
| Immigrants | Spain | 30.7 /100 | #192 | Fair 5.5% |
| Immigrants | Afghanistan | 29.3 /100 | #193 | Fair 5.5% |
| Immigrants | Chile | 29.2 /100 | #194 | Fair 5.5% |
| Colombians | 22.8 /100 | #195 | Fair 5.6% |
| Spaniards | 22.8 /100 | #196 | Fair 5.6% |
| Immigrants | Colombia | 21.4 /100 | #197 | Fair 5.6% |
| Arabs | 21.4 /100 | #198 | Fair 5.6% |
| Marshallese | 20.2 /100 | #199 | Fair 5.6% |
| Menominee | 18.6 /100 | #200 | Poor 5.6% |
| Immigrants | Morocco | 17.9 /100 | #201 | Poor 5.6% |
| Immigrants | Micronesia | 17.1 /100 | #202 | Poor 5.6% |
| Portuguese | 15.9 /100 | #203 | Poor 5.6% |
| Israelis | 15.6 /100 | #204 | Poor 5.6% |
| Tsimshian | 15.2 /100 | #205 | Poor 5.6% |
| Nicaraguans | 12.3 /100 | #206 | Poor 5.6% |
| Peruvians | 12.1 /100 | #207 | Poor 5.6% |
| Immigrants | Costa Rica | 11.6 /100 | #208 | Poor 5.6% |