Immigrants from Eritrea vs Immigrants from Russia Single Male Poverty
COMPARE
Immigrants from Eritrea
Immigrants from Russia
Single Male Poverty
Single Male Poverty Comparison
Immigrants from Eritrea
Immigrants from Russia
12.1%
SINGLE MALE POVERTY
98.5/ 100
METRIC RATING
88th/ 347
METRIC RANK
11.9%
SINGLE MALE POVERTY
99.6/ 100
METRIC RATING
69th/ 347
METRIC RANK
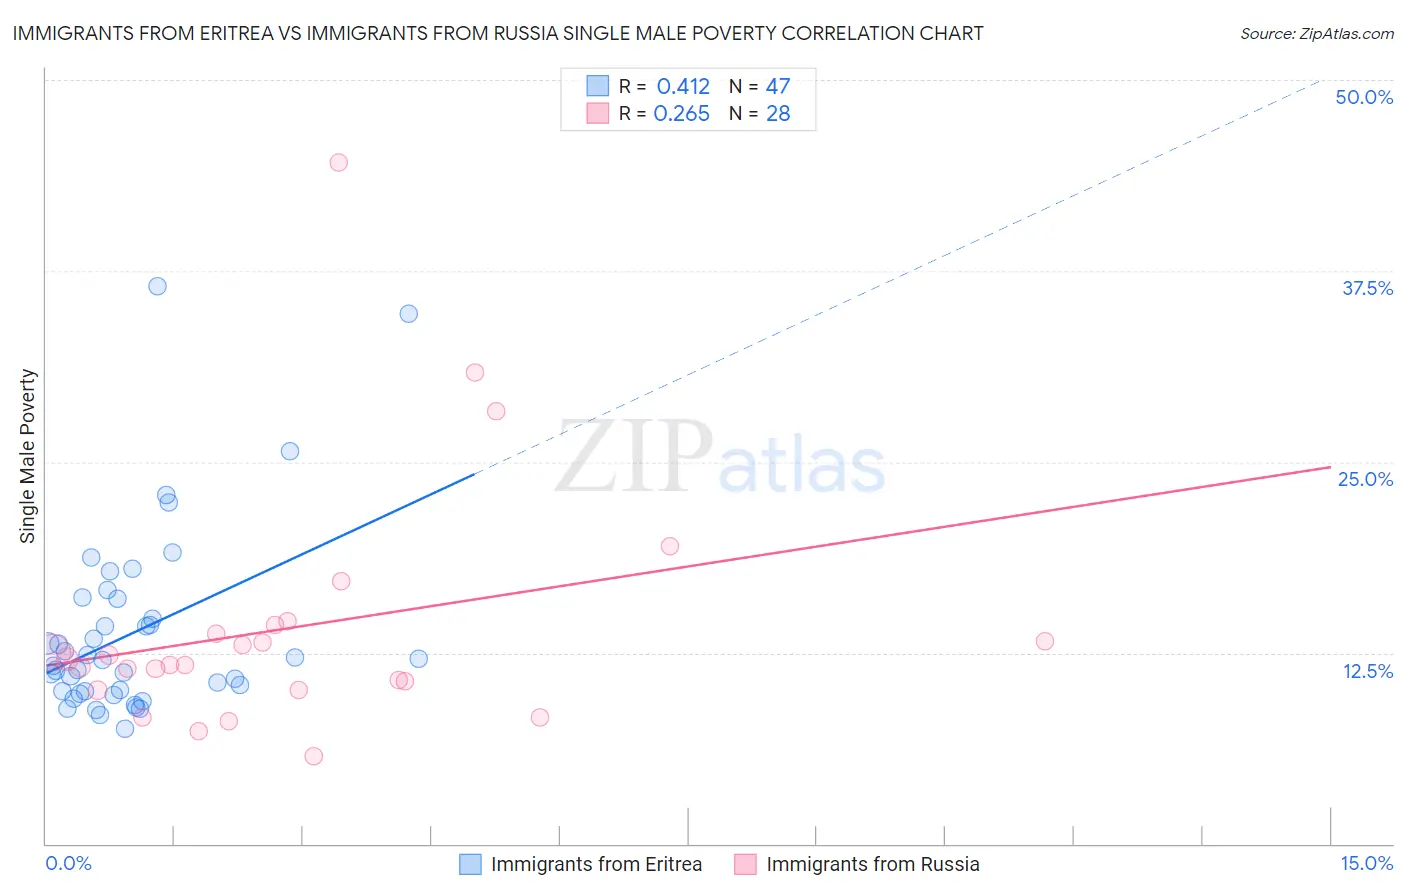
Immigrants from Eritrea vs Immigrants from Russia Single Male Poverty Correlation Chart
The statistical analysis conducted on geographies consisting of 101,335,680 people shows a moderate positive correlation between the proportion of Immigrants from Eritrea and poverty level among single males in the United States with a correlation coefficient (R) of 0.412 and weighted average of 12.1%. Similarly, the statistical analysis conducted on geographies consisting of 307,851,464 people shows a weak positive correlation between the proportion of Immigrants from Russia and poverty level among single males in the United States with a correlation coefficient (R) of 0.265 and weighted average of 11.9%, a difference of 1.9%.
Single Male Poverty Correlation Summary
| Measurement | Immigrants from Eritrea | Immigrants from Russia |
| Minimum | 7.5% | 5.8% |
| Maximum | 36.5% | 44.6% |
| Range | 29.0% | 38.8% |
| Mean | 13.9% | 14.2% |
| Median | 12.1% | 11.9% |
| Interquartile 25% (IQ1) | 10.0% | 10.4% |
| Interquartile 75% (IQ3) | 16.0% | 14.0% |
| Interquartile Range (IQR) | 6.0% | 3.6% |
| Standard Deviation (Sample) | 6.1% | 8.1% |
| Standard Deviation (Population) | 6.1% | 7.9% |
Demographics Similar to Immigrants from Eritrea and Immigrants from Russia by Single Male Poverty
In terms of single male poverty, the demographic groups most similar to Immigrants from Eritrea are South American (12.1%, a difference of 0.0%), Immigrants from Israel (12.1%, a difference of 0.020%), Turkish (12.1%, a difference of 0.040%), Immigrants from Czechoslovakia (12.1%, a difference of 0.11%), and Immigrants from Colombia (12.1%, a difference of 0.14%). Similarly, the demographic groups most similar to Immigrants from Russia are Immigrants from Croatia (11.9%, a difference of 0.020%), Immigrants from Nepal (11.9%, a difference of 0.020%), Immigrants from Greece (11.9%, a difference of 0.080%), Immigrants from Argentina (11.9%, a difference of 0.26%), and Argentinean (11.9%, a difference of 0.39%).
| Demographics | Rating | Rank | Single Male Poverty |
| Immigrants | Croatia | 99.6 /100 | #68 | Exceptional 11.9% |
| Immigrants | Russia | 99.6 /100 | #69 | Exceptional 11.9% |
| Immigrants | Nepal | 99.6 /100 | #70 | Exceptional 11.9% |
| Immigrants | Greece | 99.6 /100 | #71 | Exceptional 11.9% |
| Immigrants | Argentina | 99.5 /100 | #72 | Exceptional 11.9% |
| Argentineans | 99.5 /100 | #73 | Exceptional 11.9% |
| Chileans | 99.5 /100 | #74 | Exceptional 11.9% |
| Uruguayans | 99.4 /100 | #75 | Exceptional 11.9% |
| Immigrants | Northern Africa | 99.4 /100 | #76 | Exceptional 11.9% |
| Immigrants | Malaysia | 99.2 /100 | #77 | Exceptional 12.0% |
| Immigrants | Venezuela | 99.1 /100 | #78 | Exceptional 12.0% |
| Immigrants | Belgium | 99.0 /100 | #79 | Exceptional 12.0% |
| Armenians | 98.7 /100 | #80 | Exceptional 12.1% |
| Immigrants | South America | 98.7 /100 | #81 | Exceptional 12.1% |
| Immigrants | Colombia | 98.6 /100 | #82 | Exceptional 12.1% |
| Immigrants | Chile | 98.6 /100 | #83 | Exceptional 12.1% |
| Immigrants | Czechoslovakia | 98.6 /100 | #84 | Exceptional 12.1% |
| Turks | 98.5 /100 | #85 | Exceptional 12.1% |
| Immigrants | Israel | 98.5 /100 | #86 | Exceptional 12.1% |
| South Americans | 98.5 /100 | #87 | Exceptional 12.1% |
| Immigrants | Eritrea | 98.5 /100 | #88 | Exceptional 12.1% |