Immigrants from Eritrea vs Immigrants from Netherlands Female Poverty Among 18-24 Year Olds
COMPARE
Immigrants from Eritrea
Immigrants from Netherlands
Female Poverty Among 18-24 Year Olds
Female Poverty Among 18-24 Year Olds Comparison
Immigrants from Eritrea
Immigrants from Netherlands
20.9%
FEMALE POVERTY AMONG 18-24 YEAR OLDS
4.2/ 100
METRIC RATING
241st/ 347
METRIC RANK
20.5%
FEMALE POVERTY AMONG 18-24 YEAR OLDS
17.0/ 100
METRIC RATING
204th/ 347
METRIC RANK
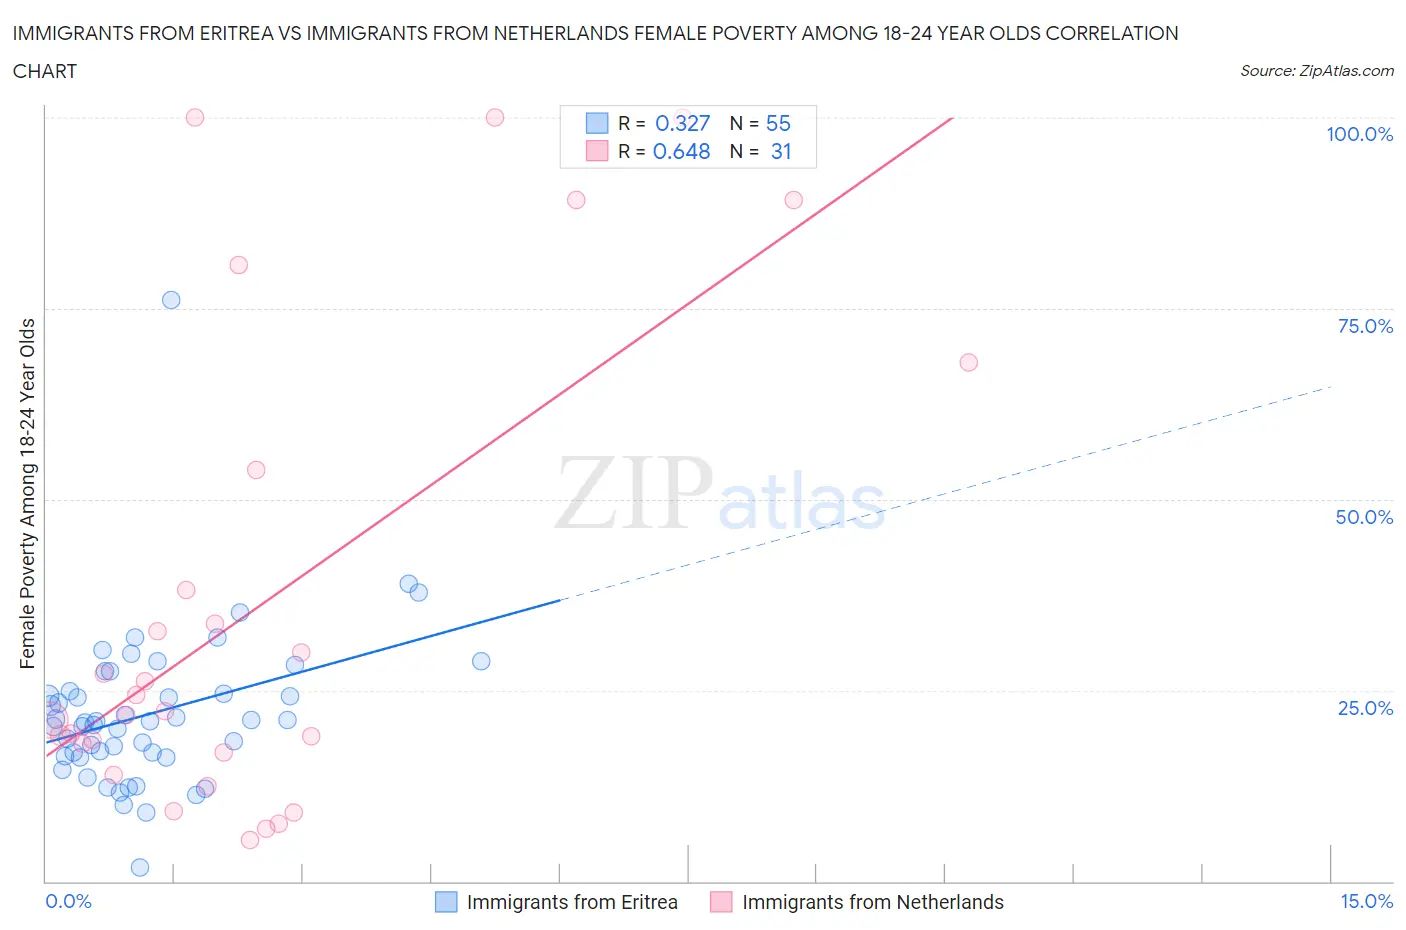
Immigrants from Eritrea vs Immigrants from Netherlands Female Poverty Among 18-24 Year Olds Correlation Chart
The statistical analysis conducted on geographies consisting of 104,465,492 people shows a mild positive correlation between the proportion of Immigrants from Eritrea and poverty level among females between the ages 18 and 24 in the United States with a correlation coefficient (R) of 0.327 and weighted average of 20.9%. Similarly, the statistical analysis conducted on geographies consisting of 233,588,287 people shows a significant positive correlation between the proportion of Immigrants from Netherlands and poverty level among females between the ages 18 and 24 in the United States with a correlation coefficient (R) of 0.648 and weighted average of 20.5%, a difference of 1.9%.
Female Poverty Among 18-24 Year Olds Correlation Summary
| Measurement | Immigrants from Eritrea | Immigrants from Netherlands |
| Minimum | 1.8% | 5.4% |
| Maximum | 76.0% | 100.0% |
| Range | 74.2% | 94.6% |
| Mean | 21.9% | 36.6% |
| Median | 21.0% | 22.3% |
| Interquartile 25% (IQ1) | 16.4% | 16.9% |
| Interquartile 75% (IQ3) | 24.9% | 53.8% |
| Interquartile Range (IQR) | 8.5% | 37.0% |
| Standard Deviation (Sample) | 10.5% | 31.2% |
| Standard Deviation (Population) | 10.4% | 30.7% |
Similar Demographics by Female Poverty Among 18-24 Year Olds
Demographics Similar to Immigrants from Eritrea by Female Poverty Among 18-24 Year Olds
In terms of female poverty among 18-24 year olds, the demographic groups most similar to Immigrants from Eritrea are Israeli (20.9%, a difference of 0.010%), Luxembourger (20.9%, a difference of 0.020%), Immigrants from Guatemala (20.9%, a difference of 0.040%), Immigrants from Singapore (20.9%, a difference of 0.050%), and Scottish (20.9%, a difference of 0.090%).
| Demographics | Rating | Rank | Female Poverty Among 18-24 Year Olds |
| Welsh | 5.4 /100 | #234 | Tragic 20.8% |
| Immigrants | Uganda | 5.1 /100 | #235 | Tragic 20.8% |
| Okinawans | 4.9 /100 | #236 | Tragic 20.8% |
| Scottish | 4.5 /100 | #237 | Tragic 20.9% |
| Immigrants | Singapore | 4.4 /100 | #238 | Tragic 20.9% |
| Immigrants | Guatemala | 4.3 /100 | #239 | Tragic 20.9% |
| Luxembourgers | 4.2 /100 | #240 | Tragic 20.9% |
| Immigrants | Eritrea | 4.2 /100 | #241 | Tragic 20.9% |
| Israelis | 4.1 /100 | #242 | Tragic 20.9% |
| Marshallese | 3.4 /100 | #243 | Tragic 20.9% |
| Immigrants | Thailand | 3.4 /100 | #244 | Tragic 20.9% |
| Aleuts | 3.3 /100 | #245 | Tragic 20.9% |
| Immigrants | Australia | 3.1 /100 | #246 | Tragic 20.9% |
| Immigrants | Africa | 3.0 /100 | #247 | Tragic 21.0% |
| Immigrants | Kenya | 2.5 /100 | #248 | Tragic 21.0% |
Demographics Similar to Immigrants from Netherlands by Female Poverty Among 18-24 Year Olds
In terms of female poverty among 18-24 year olds, the demographic groups most similar to Immigrants from Netherlands are Immigrants from Malaysia (20.5%, a difference of 0.020%), English (20.5%, a difference of 0.020%), Hispanic or Latino (20.5%, a difference of 0.030%), Spaniard (20.5%, a difference of 0.050%), and Immigrants from Turkey (20.5%, a difference of 0.060%).
| Demographics | Rating | Rank | Female Poverty Among 18-24 Year Olds |
| Zimbabweans | 21.0 /100 | #197 | Fair 20.4% |
| Immigrants | Spain | 20.7 /100 | #198 | Fair 20.4% |
| Germans | 20.6 /100 | #199 | Fair 20.4% |
| Europeans | 19.9 /100 | #200 | Poor 20.4% |
| Mexicans | 18.3 /100 | #201 | Poor 20.5% |
| Immigrants | Turkey | 17.7 /100 | #202 | Poor 20.5% |
| Immigrants | Malaysia | 17.2 /100 | #203 | Poor 20.5% |
| Immigrants | Netherlands | 17.0 /100 | #204 | Poor 20.5% |
| English | 16.7 /100 | #205 | Poor 20.5% |
| Hispanics or Latinos | 16.6 /100 | #206 | Poor 20.5% |
| Spaniards | 16.3 /100 | #207 | Poor 20.5% |
| Dutch | 15.9 /100 | #208 | Poor 20.5% |
| Arabs | 15.5 /100 | #209 | Poor 20.5% |
| Immigrants | Ghana | 14.3 /100 | #210 | Poor 20.5% |
| Immigrants | Western Europe | 13.5 /100 | #211 | Poor 20.6% |