Immigrants from Eritrea vs Estonian Female Poverty Among 18-24 Year Olds
COMPARE
Immigrants from Eritrea
Estonian
Female Poverty Among 18-24 Year Olds
Female Poverty Among 18-24 Year Olds Comparison
Immigrants from Eritrea
Estonians
20.9%
FEMALE POVERTY AMONG 18-24 YEAR OLDS
4.2/ 100
METRIC RATING
241st/ 347
METRIC RANK
20.7%
FEMALE POVERTY AMONG 18-24 YEAR OLDS
7.2/ 100
METRIC RATING
226th/ 347
METRIC RANK
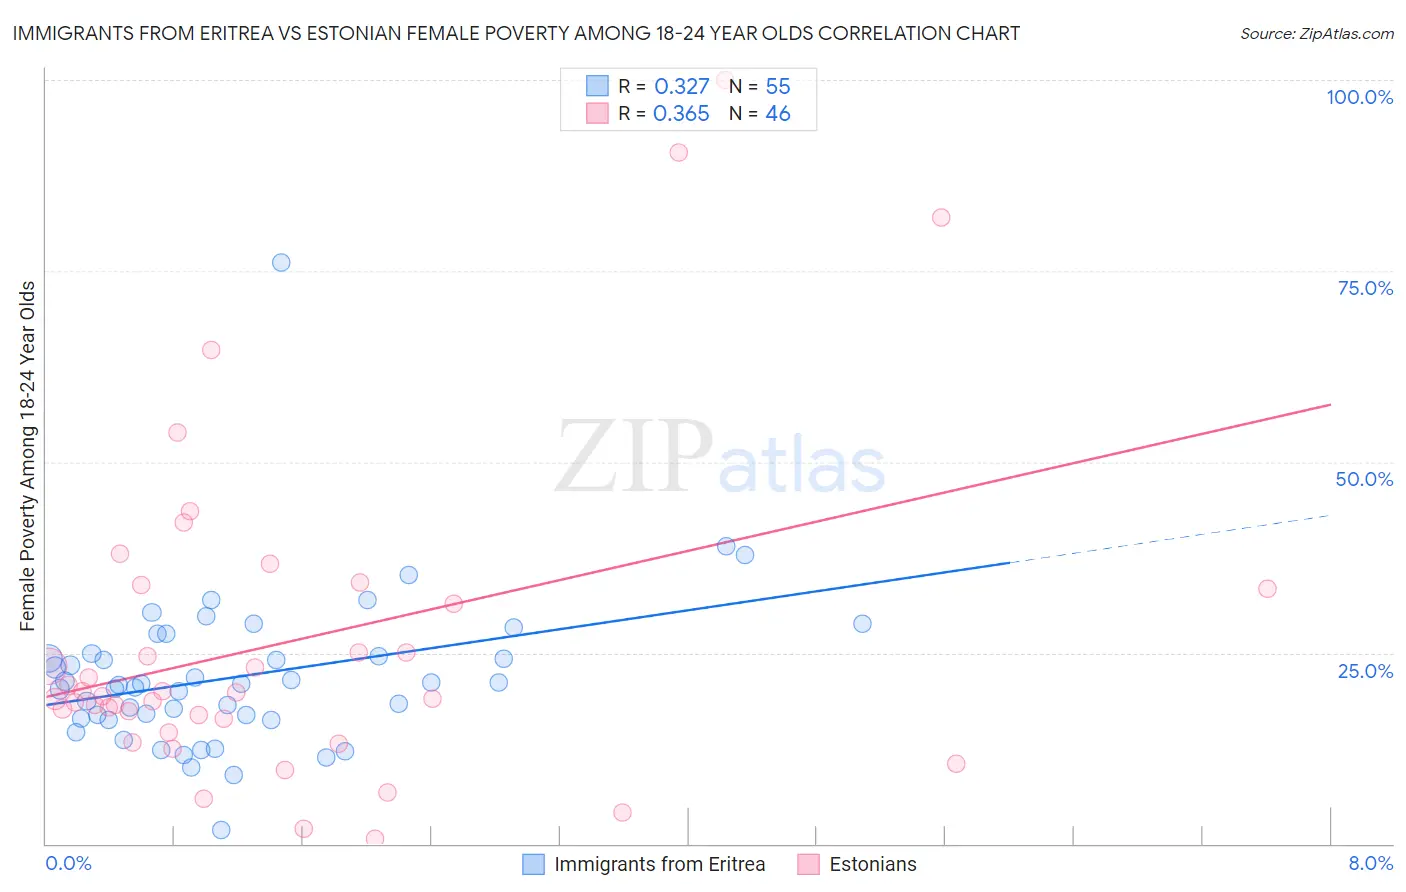
Immigrants from Eritrea vs Estonian Female Poverty Among 18-24 Year Olds Correlation Chart
The statistical analysis conducted on geographies consisting of 104,465,492 people shows a mild positive correlation between the proportion of Immigrants from Eritrea and poverty level among females between the ages 18 and 24 in the United States with a correlation coefficient (R) of 0.327 and weighted average of 20.9%. Similarly, the statistical analysis conducted on geographies consisting of 122,061,434 people shows a mild positive correlation between the proportion of Estonians and poverty level among females between the ages 18 and 24 in the United States with a correlation coefficient (R) of 0.365 and weighted average of 20.7%, a difference of 0.68%.
Female Poverty Among 18-24 Year Olds Correlation Summary
| Measurement | Immigrants from Eritrea | Estonian |
| Minimum | 1.8% | 0.60% |
| Maximum | 76.0% | 100.0% |
| Range | 74.2% | 99.4% |
| Mean | 21.9% | 26.4% |
| Median | 21.0% | 19.5% |
| Interquartile 25% (IQ1) | 16.4% | 16.4% |
| Interquartile 75% (IQ3) | 24.9% | 33.3% |
| Interquartile Range (IQR) | 8.5% | 17.0% |
| Standard Deviation (Sample) | 10.5% | 21.4% |
| Standard Deviation (Population) | 10.4% | 21.2% |
Demographics Similar to Immigrants from Eritrea and Estonians by Female Poverty Among 18-24 Year Olds
In terms of female poverty among 18-24 year olds, the demographic groups most similar to Immigrants from Eritrea are Israeli (20.9%, a difference of 0.010%), Luxembourger (20.9%, a difference of 0.020%), Immigrants from Guatemala (20.9%, a difference of 0.040%), Immigrants from Singapore (20.9%, a difference of 0.050%), and Scottish (20.9%, a difference of 0.090%). Similarly, the demographic groups most similar to Estonians are Norwegian (20.7%, a difference of 0.020%), Immigrants from Sweden (20.7%, a difference of 0.070%), Immigrants from Liberia (20.7%, a difference of 0.080%), French (20.7%, a difference of 0.13%), and Ghanaian (20.8%, a difference of 0.13%).
| Demographics | Rating | Rank | Female Poverty Among 18-24 Year Olds |
| French | 7.9 /100 | #223 | Tragic 20.7% |
| Immigrants | Liberia | 7.6 /100 | #224 | Tragic 20.7% |
| Norwegians | 7.3 /100 | #225 | Tragic 20.7% |
| Estonians | 7.2 /100 | #226 | Tragic 20.7% |
| Immigrants | Sweden | 6.8 /100 | #227 | Tragic 20.7% |
| Ghanaians | 6.5 /100 | #228 | Tragic 20.8% |
| Australians | 6.1 /100 | #229 | Tragic 20.8% |
| Whites/Caucasians | 6.1 /100 | #230 | Tragic 20.8% |
| Immigrants | St. Vincent and the Grenadines | 6.0 /100 | #231 | Tragic 20.8% |
| Finns | 6.0 /100 | #232 | Tragic 20.8% |
| Immigrants | Denmark | 5.8 /100 | #233 | Tragic 20.8% |
| Welsh | 5.4 /100 | #234 | Tragic 20.8% |
| Immigrants | Uganda | 5.1 /100 | #235 | Tragic 20.8% |
| Okinawans | 4.9 /100 | #236 | Tragic 20.8% |
| Scottish | 4.5 /100 | #237 | Tragic 20.9% |
| Immigrants | Singapore | 4.4 /100 | #238 | Tragic 20.9% |
| Immigrants | Guatemala | 4.3 /100 | #239 | Tragic 20.9% |
| Luxembourgers | 4.2 /100 | #240 | Tragic 20.9% |
| Immigrants | Eritrea | 4.2 /100 | #241 | Tragic 20.9% |
| Israelis | 4.1 /100 | #242 | Tragic 20.9% |
| Marshallese | 3.4 /100 | #243 | Tragic 20.9% |