Immigrants from El Salvador vs British Single Female Poverty
COMPARE
Immigrants from El Salvador
British
Single Female Poverty
Single Female Poverty Comparison
Immigrants from El Salvador
British
22.4%
SINGLE FEMALE POVERTY
1.4/ 100
METRIC RATING
247th/ 347
METRIC RANK
21.1%
SINGLE FEMALE POVERTY
42.9/ 100
METRIC RATING
179th/ 347
METRIC RANK
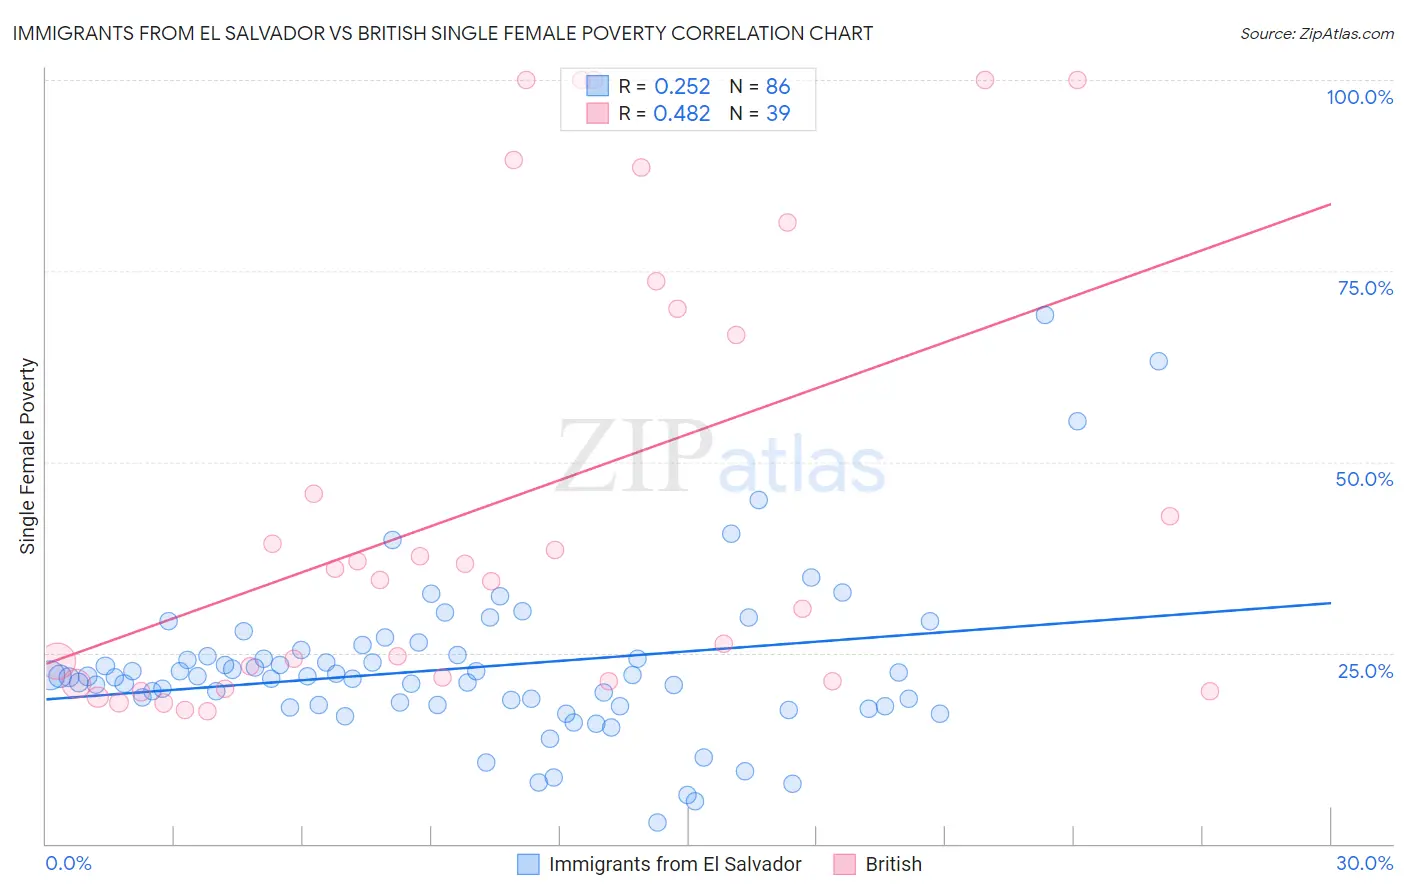
Immigrants from El Salvador vs British Single Female Poverty Correlation Chart
The statistical analysis conducted on geographies consisting of 354,692,834 people shows a weak positive correlation between the proportion of Immigrants from El Salvador and poverty level among single females in the United States with a correlation coefficient (R) of 0.252 and weighted average of 22.4%. Similarly, the statistical analysis conducted on geographies consisting of 516,545,848 people shows a moderate positive correlation between the proportion of British and poverty level among single females in the United States with a correlation coefficient (R) of 0.482 and weighted average of 21.1%, a difference of 6.2%.
Single Female Poverty Correlation Summary
| Measurement | Immigrants from El Salvador | British |
| Minimum | 2.9% | 17.3% |
| Maximum | 69.3% | 100.0% |
| Range | 66.4% | 82.7% |
| Mean | 23.0% | 44.7% |
| Median | 21.9% | 34.5% |
| Interquartile 25% (IQ1) | 18.1% | 21.2% |
| Interquartile 75% (IQ3) | 24.8% | 70.0% |
| Interquartile Range (IQR) | 6.6% | 48.8% |
| Standard Deviation (Sample) | 10.5% | 29.4% |
| Standard Deviation (Population) | 10.5% | 29.0% |
Similar Demographics by Single Female Poverty
Demographics Similar to Immigrants from El Salvador by Single Female Poverty
In terms of single female poverty, the demographic groups most similar to Immigrants from El Salvador are Belizean (22.4%, a difference of 0.010%), Liberian (22.4%, a difference of 0.060%), Immigrants from Caribbean (22.4%, a difference of 0.11%), Immigrants from Bahamas (22.5%, a difference of 0.26%), and Immigrants from West Indies (22.5%, a difference of 0.40%).
| Demographics | Rating | Rank | Single Female Poverty |
| French | 2.3 /100 | #240 | Tragic 22.2% |
| Cape Verdeans | 2.1 /100 | #241 | Tragic 22.3% |
| Bermudans | 2.0 /100 | #242 | Tragic 22.3% |
| West Indians | 1.9 /100 | #243 | Tragic 22.3% |
| Immigrants | Middle Africa | 1.9 /100 | #244 | Tragic 22.3% |
| Immigrants | Bangladesh | 1.8 /100 | #245 | Tragic 22.3% |
| Liberians | 1.4 /100 | #246 | Tragic 22.4% |
| Immigrants | El Salvador | 1.4 /100 | #247 | Tragic 22.4% |
| Belizeans | 1.4 /100 | #248 | Tragic 22.4% |
| Immigrants | Caribbean | 1.3 /100 | #249 | Tragic 22.4% |
| Immigrants | Bahamas | 1.2 /100 | #250 | Tragic 22.5% |
| Immigrants | West Indies | 1.0 /100 | #251 | Tragic 22.5% |
| Delaware | 1.0 /100 | #252 | Tragic 22.5% |
| Immigrants | Liberia | 0.9 /100 | #253 | Tragic 22.5% |
| Immigrants | Burma/Myanmar | 0.8 /100 | #254 | Tragic 22.6% |
Demographics Similar to British by Single Female Poverty
In terms of single female poverty, the demographic groups most similar to British are Spanish American Indian (21.1%, a difference of 0.030%), European (21.1%, a difference of 0.040%), Immigrants from Bosnia and Herzegovina (21.1%, a difference of 0.12%), Scandinavian (21.1%, a difference of 0.14%), and Slavic (21.1%, a difference of 0.15%).
| Demographics | Rating | Rank | Single Female Poverty |
| Guyanese | 52.0 /100 | #172 | Average 21.0% |
| Immigrants | Guyana | 50.6 /100 | #173 | Average 21.0% |
| Cubans | 50.0 /100 | #174 | Average 21.0% |
| Czechs | 46.8 /100 | #175 | Average 21.0% |
| Canadians | 45.4 /100 | #176 | Average 21.1% |
| Scandinavians | 45.2 /100 | #177 | Average 21.1% |
| Immigrants | Bosnia and Herzegovina | 44.9 /100 | #178 | Average 21.1% |
| British | 42.9 /100 | #179 | Average 21.1% |
| Spanish American Indians | 42.5 /100 | #180 | Average 21.1% |
| Europeans | 42.3 /100 | #181 | Average 21.1% |
| Slavs | 40.5 /100 | #182 | Average 21.1% |
| Slovaks | 39.7 /100 | #183 | Fair 21.1% |
| Hungarians | 39.6 /100 | #184 | Fair 21.1% |
| Immigrants | Cambodia | 38.2 /100 | #185 | Fair 21.2% |
| Hawaiians | 37.7 /100 | #186 | Fair 21.2% |