Immigrants from El Salvador vs British 1 or more Vehicles in Household
COMPARE
Immigrants from El Salvador
British
1 or more Vehicles in Household
1 or more Vehicles in Household Comparison
Immigrants from El Salvador
British
89.6%
1 OR MORE VEHICLES IN HOUSEHOLD
44.1/ 100
METRIC RATING
178th/ 347
METRIC RANK
92.5%
1 OR MORE VEHICLES IN HOUSEHOLD
100.0/ 100
METRIC RATING
26th/ 347
METRIC RANK
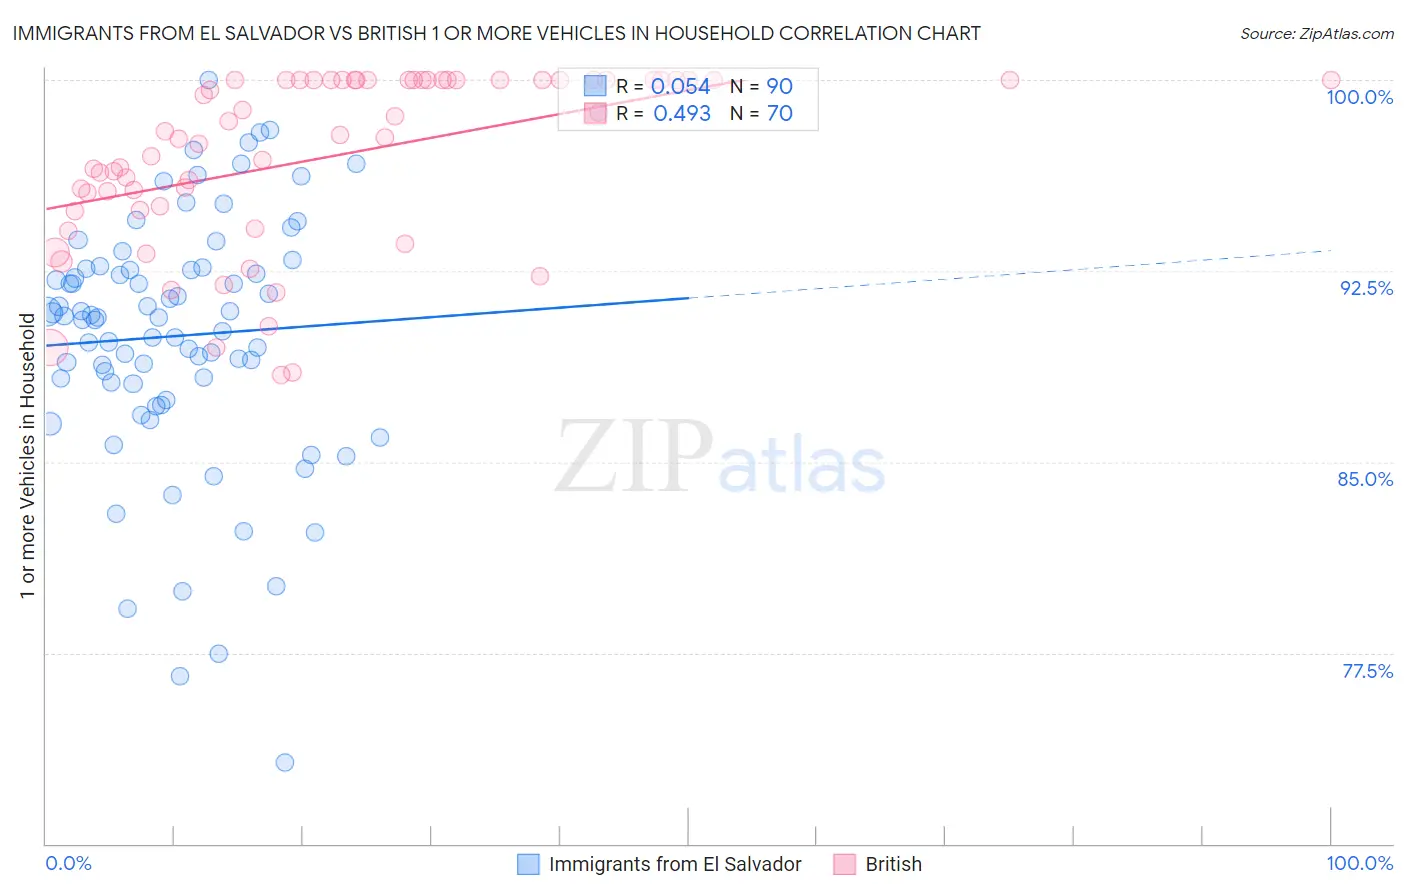
Immigrants from El Salvador vs British 1 or more Vehicles in Household Correlation Chart
The statistical analysis conducted on geographies consisting of 357,719,438 people shows a slight positive correlation between the proportion of Immigrants from El Salvador and percentage of households with 1 or more vehicles available in the United States with a correlation coefficient (R) of 0.054 and weighted average of 89.6%. Similarly, the statistical analysis conducted on geographies consisting of 531,095,342 people shows a moderate positive correlation between the proportion of British and percentage of households with 1 or more vehicles available in the United States with a correlation coefficient (R) of 0.493 and weighted average of 92.5%, a difference of 3.3%.
1 or more Vehicles in Household Correlation Summary
| Measurement | Immigrants from El Salvador | British |
| Minimum | 73.2% | 88.4% |
| Maximum | 100.0% | 100.0% |
| Range | 26.8% | 11.6% |
| Mean | 90.0% | 96.9% |
| Median | 90.7% | 97.8% |
| Interquartile 25% (IQ1) | 88.1% | 94.9% |
| Interquartile 75% (IQ3) | 92.6% | 100.0% |
| Interquartile Range (IQR) | 4.5% | 5.1% |
| Standard Deviation (Sample) | 5.0% | 3.4% |
| Standard Deviation (Population) | 5.0% | 3.4% |
Similar Demographics by 1 or more Vehicles in Household
Demographics Similar to Immigrants from El Salvador by 1 or more Vehicles in Household
In terms of 1 or more vehicles in household, the demographic groups most similar to Immigrants from El Salvador are German Russian (89.6%, a difference of 0.0%), Arab (89.6%, a difference of 0.010%), Hmong (89.6%, a difference of 0.030%), Immigrants from Ethiopia (89.6%, a difference of 0.030%), and Ukrainian (89.6%, a difference of 0.030%).
| Demographics | Rating | Rank | 1 or more Vehicles in Household |
| French American Indians | 54.4 /100 | #171 | Average 89.8% |
| Indonesians | 53.0 /100 | #172 | Average 89.7% |
| Lumbee | 52.8 /100 | #173 | Average 89.7% |
| Filipinos | 50.0 /100 | #174 | Average 89.7% |
| Immigrants | Burma/Myanmar | 47.6 /100 | #175 | Average 89.7% |
| Immigrants | Sudan | 47.1 /100 | #176 | Average 89.7% |
| Hmong | 45.8 /100 | #177 | Average 89.6% |
| Immigrants | El Salvador | 44.1 /100 | #178 | Average 89.6% |
| German Russians | 44.0 /100 | #179 | Average 89.6% |
| Arabs | 43.3 /100 | #180 | Average 89.6% |
| Immigrants | Ethiopia | 42.5 /100 | #181 | Average 89.6% |
| Ukrainians | 42.4 /100 | #182 | Average 89.6% |
| Ethiopians | 41.2 /100 | #183 | Average 89.6% |
| Immigrants | Bulgaria | 40.7 /100 | #184 | Average 89.6% |
| Immigrants | Brazil | 40.1 /100 | #185 | Average 89.6% |
Demographics Similar to British by 1 or more Vehicles in Household
In terms of 1 or more vehicles in household, the demographic groups most similar to British are Immigrants from Iraq (92.5%, a difference of 0.020%), Yaqui (92.6%, a difference of 0.040%), American (92.5%, a difference of 0.050%), Sri Lankan (92.5%, a difference of 0.080%), and Native Hawaiian (92.4%, a difference of 0.090%).
| Demographics | Rating | Rank | 1 or more Vehicles in Household |
| Tongans | 100.0 /100 | #19 | Exceptional 92.9% |
| Arapaho | 100.0 /100 | #20 | Exceptional 92.7% |
| Ottawa | 100.0 /100 | #21 | Exceptional 92.7% |
| French | 100.0 /100 | #22 | Exceptional 92.7% |
| Nepalese | 100.0 /100 | #23 | Exceptional 92.6% |
| Yaqui | 100.0 /100 | #24 | Exceptional 92.6% |
| Immigrants | Iraq | 100.0 /100 | #25 | Exceptional 92.5% |
| British | 100.0 /100 | #26 | Exceptional 92.5% |
| Americans | 100.0 /100 | #27 | Exceptional 92.5% |
| Sri Lankans | 100.0 /100 | #28 | Exceptional 92.5% |
| Native Hawaiians | 100.0 /100 | #29 | Exceptional 92.4% |
| Finns | 100.0 /100 | #30 | Exceptional 92.4% |
| Samoans | 100.0 /100 | #31 | Exceptional 92.4% |
| Basques | 100.0 /100 | #32 | Exceptional 92.4% |
| Cherokee | 100.0 /100 | #33 | Exceptional 92.4% |