Immigrants from Ecuador vs Celtic Male Poverty
COMPARE
Immigrants from Ecuador
Celtic
Male Poverty
Male Poverty Comparison
Immigrants from Ecuador
Celtics
12.9%
MALE POVERTY
0.2/ 100
METRIC RATING
252nd/ 347
METRIC RANK
11.2%
MALE POVERTY
47.5/ 100
METRIC RATING
175th/ 347
METRIC RANK
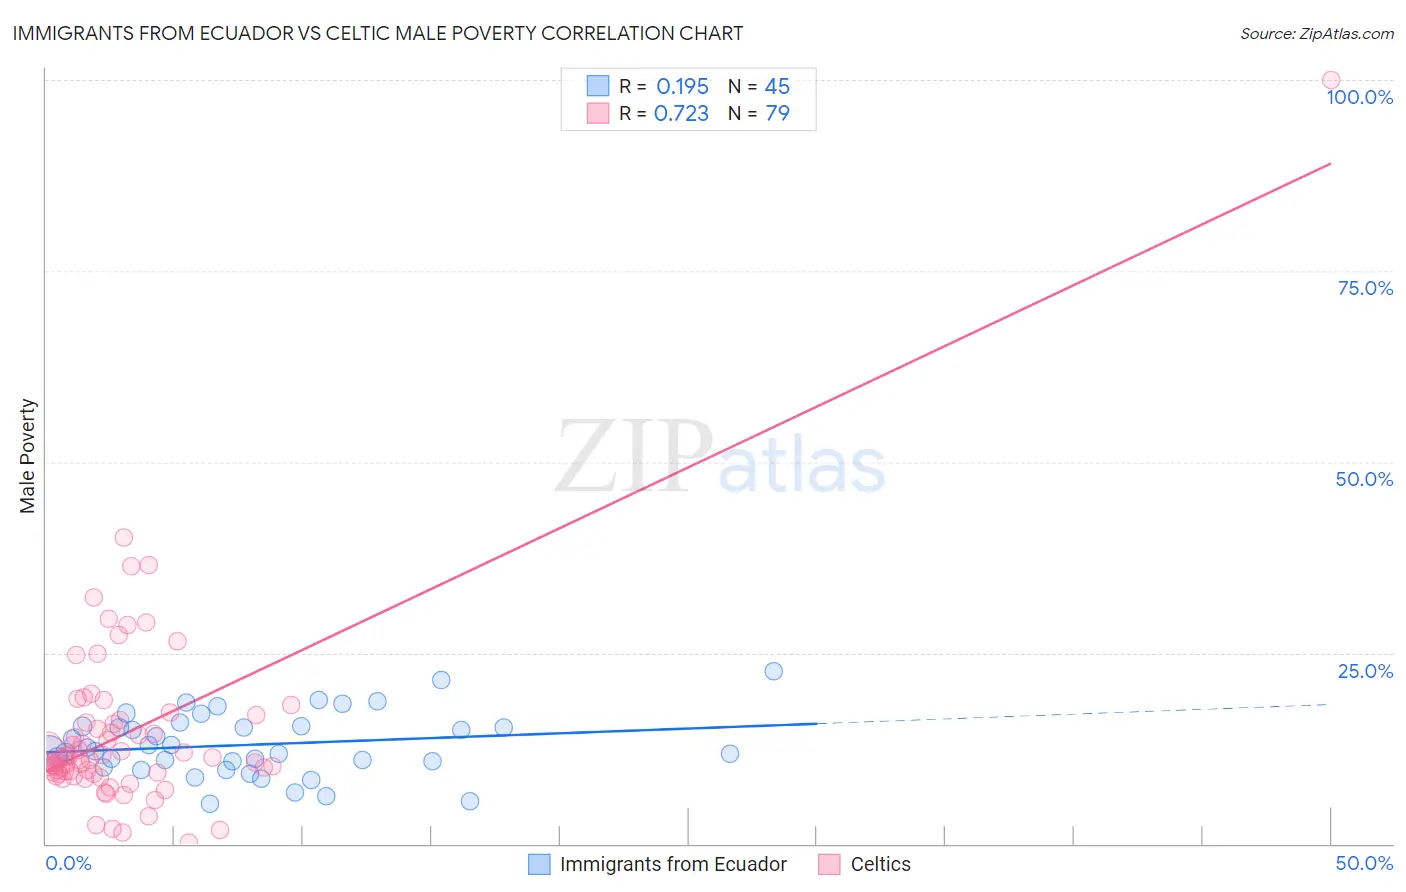
Immigrants from Ecuador vs Celtic Male Poverty Correlation Chart
The statistical analysis conducted on geographies consisting of 270,825,114 people shows a poor positive correlation between the proportion of Immigrants from Ecuador and poverty level among males in the United States with a correlation coefficient (R) of 0.195 and weighted average of 12.9%. Similarly, the statistical analysis conducted on geographies consisting of 168,829,630 people shows a strong positive correlation between the proportion of Celtics and poverty level among males in the United States with a correlation coefficient (R) of 0.723 and weighted average of 11.2%, a difference of 15.2%.
Male Poverty Correlation Summary
| Measurement | Immigrants from Ecuador | Celtic |
| Minimum | 5.2% | 0.22% |
| Maximum | 22.6% | 100.0% |
| Range | 17.4% | 99.8% |
| Mean | 13.0% | 14.6% |
| Median | 12.1% | 11.2% |
| Interquartile 25% (IQ1) | 10.4% | 9.2% |
| Interquartile 75% (IQ3) | 15.4% | 16.2% |
| Interquartile Range (IQR) | 4.9% | 6.9% |
| Standard Deviation (Sample) | 4.1% | 12.7% |
| Standard Deviation (Population) | 4.0% | 12.6% |
Similar Demographics by Male Poverty
Demographics Similar to Immigrants from Ecuador by Male Poverty
In terms of male poverty, the demographic groups most similar to Immigrants from Ecuador are Immigrants from Cuba (12.9%, a difference of 0.030%), Immigrants from Ghana (12.9%, a difference of 0.050%), Immigrants from Nicaragua (12.9%, a difference of 0.13%), Potawatomi (12.9%, a difference of 0.14%), and Immigrants from Sudan (12.9%, a difference of 0.21%).
| Demographics | Rating | Rank | Male Poverty |
| Liberians | 0.3 /100 | #245 | Tragic 12.8% |
| Immigrants | El Salvador | 0.2 /100 | #246 | Tragic 12.8% |
| Immigrants | Western Africa | 0.2 /100 | #247 | Tragic 12.9% |
| Immigrants | Sudan | 0.2 /100 | #248 | Tragic 12.9% |
| Potawatomi | 0.2 /100 | #249 | Tragic 12.9% |
| Immigrants | Nicaragua | 0.2 /100 | #250 | Tragic 12.9% |
| Immigrants | Cuba | 0.2 /100 | #251 | Tragic 12.9% |
| Immigrants | Ecuador | 0.2 /100 | #252 | Tragic 12.9% |
| Immigrants | Ghana | 0.2 /100 | #253 | Tragic 12.9% |
| Mexican American Indians | 0.1 /100 | #254 | Tragic 13.0% |
| Immigrants | Liberia | 0.1 /100 | #255 | Tragic 13.0% |
| Immigrants | Burma/Myanmar | 0.1 /100 | #256 | Tragic 13.0% |
| Immigrants | Trinidad and Tobago | 0.1 /100 | #257 | Tragic 13.1% |
| Cape Verdeans | 0.1 /100 | #258 | Tragic 13.1% |
| Cherokee | 0.1 /100 | #259 | Tragic 13.1% |
Demographics Similar to Celtics by Male Poverty
In terms of male poverty, the demographic groups most similar to Celtics are Immigrants from Fiji (11.2%, a difference of 0.14%), Lebanese (11.2%, a difference of 0.18%), Immigrants from Oceania (11.2%, a difference of 0.25%), Pennsylvania German (11.2%, a difference of 0.29%), and Immigrants from Cameroon (11.2%, a difference of 0.29%).
| Demographics | Rating | Rank | Male Poverty |
| Immigrants | Portugal | 54.9 /100 | #168 | Average 11.1% |
| Immigrants | Colombia | 54.2 /100 | #169 | Average 11.1% |
| South Americans | 53.8 /100 | #170 | Average 11.1% |
| Uruguayans | 51.0 /100 | #171 | Average 11.2% |
| Immigrants | Ethiopia | 50.7 /100 | #172 | Average 11.2% |
| Pennsylvania Germans | 50.5 /100 | #173 | Average 11.2% |
| Immigrants | Oceania | 50.0 /100 | #174 | Average 11.2% |
| Celtics | 47.5 /100 | #175 | Average 11.2% |
| Immigrants | Fiji | 46.0 /100 | #176 | Average 11.2% |
| Lebanese | 45.6 /100 | #177 | Average 11.2% |
| Immigrants | Cameroon | 44.5 /100 | #178 | Average 11.2% |
| Immigrants | Syria | 40.3 /100 | #179 | Average 11.3% |
| Immigrants | Morocco | 40.1 /100 | #180 | Average 11.3% |
| Immigrants | Costa Rica | 39.5 /100 | #181 | Fair 11.3% |
| Mongolians | 39.0 /100 | #182 | Fair 11.3% |