Immigrants from Eastern Europe vs Dutch Poverty
COMPARE
Immigrants from Eastern Europe
Dutch
Poverty
Poverty Comparison
Immigrants from Eastern Europe
Dutch
11.3%
POVERTY
97.0/ 100
METRIC RATING
75th/ 347
METRIC RANK
11.3%
POVERTY
96.7/ 100
METRIC RATING
78th/ 347
METRIC RANK
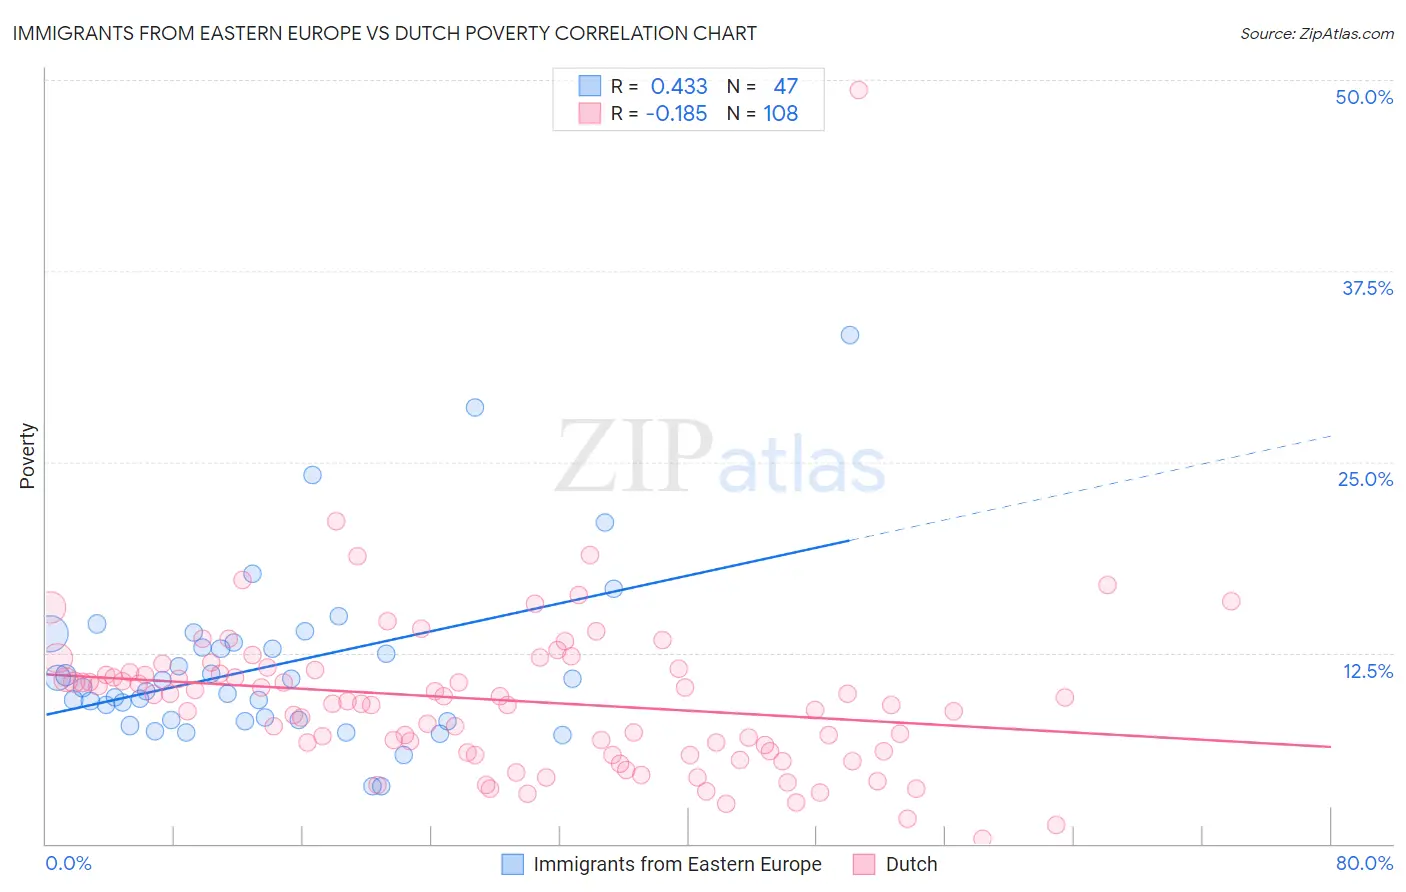
Immigrants from Eastern Europe vs Dutch Poverty Correlation Chart
The statistical analysis conducted on geographies consisting of 475,463,509 people shows a moderate positive correlation between the proportion of Immigrants from Eastern Europe and poverty level in the United States with a correlation coefficient (R) of 0.433 and weighted average of 11.3%. Similarly, the statistical analysis conducted on geographies consisting of 553,673,360 people shows a poor negative correlation between the proportion of Dutch and poverty level in the United States with a correlation coefficient (R) of -0.185 and weighted average of 11.3%, a difference of 0.24%.
Poverty Correlation Summary
| Measurement | Immigrants from Eastern Europe | Dutch |
| Minimum | 3.8% | 0.35% |
| Maximum | 33.3% | 49.4% |
| Range | 29.6% | 49.0% |
| Mean | 11.6% | 9.4% |
| Median | 10.2% | 9.3% |
| Interquartile 25% (IQ1) | 8.1% | 6.0% |
| Interquartile 75% (IQ3) | 13.2% | 11.3% |
| Interquartile Range (IQR) | 5.1% | 5.3% |
| Standard Deviation (Sample) | 5.7% | 5.6% |
| Standard Deviation (Population) | 5.6% | 5.6% |
Demographics Similar to Immigrants from Eastern Europe and Dutch by Poverty
In terms of poverty, the demographic groups most similar to Immigrants from Eastern Europe are Immigrants from North America (11.3%, a difference of 0.15%), Carpatho Rusyn (11.3%, a difference of 0.19%), Immigrants from Eastern Asia (11.3%, a difference of 0.22%), European (11.3%, a difference of 0.24%), and Immigrants from Belgium (11.3%, a difference of 0.24%). Similarly, the demographic groups most similar to Dutch are Immigrants from Eastern Asia (11.3%, a difference of 0.010%), Cambodian (11.3%, a difference of 0.040%), Indian (Asian) (11.3%, a difference of 0.060%), Irish (11.3%, a difference of 0.070%), and Immigrants from North America (11.3%, a difference of 0.080%).
| Demographics | Rating | Rank | Poverty |
| Immigrants | Netherlands | 97.5 /100 | #66 | Exceptional 11.2% |
| Immigrants | Australia | 97.4 /100 | #67 | Exceptional 11.2% |
| Slovaks | 97.4 /100 | #68 | Exceptional 11.2% |
| Serbians | 97.4 /100 | #69 | Exceptional 11.2% |
| Immigrants | Canada | 97.3 /100 | #70 | Exceptional 11.3% |
| Zimbabweans | 97.3 /100 | #71 | Exceptional 11.3% |
| Europeans | 97.2 /100 | #72 | Exceptional 11.3% |
| Immigrants | Belgium | 97.2 /100 | #73 | Exceptional 11.3% |
| Carpatho Rusyns | 97.2 /100 | #74 | Exceptional 11.3% |
| Immigrants | Eastern Europe | 97.0 /100 | #75 | Exceptional 11.3% |
| Immigrants | North America | 96.8 /100 | #76 | Exceptional 11.3% |
| Immigrants | Eastern Asia | 96.7 /100 | #77 | Exceptional 11.3% |
| Dutch | 96.7 /100 | #78 | Exceptional 11.3% |
| Cambodians | 96.7 /100 | #79 | Exceptional 11.3% |
| Indians (Asian) | 96.6 /100 | #80 | Exceptional 11.3% |
| Irish | 96.6 /100 | #81 | Exceptional 11.3% |
| Egyptians | 96.5 /100 | #82 | Exceptional 11.3% |
| Immigrants | Sweden | 96.3 /100 | #83 | Exceptional 11.3% |
| English | 96.3 /100 | #84 | Exceptional 11.3% |
| Immigrants | England | 96.2 /100 | #85 | Exceptional 11.4% |
| Jordanians | 96.0 /100 | #86 | Exceptional 11.4% |