Immigrants from Eastern Asia vs Mongolian Single Male Poverty

COMPARE

Immigrants from Eastern Asia
Race
Ancestry
AfghanAfricanAlaska NativeAlaskan AthabascanAlbanianAleutAlsatianAmericanApacheArabArapahoArgentineanArmenianAssyrian/Chaldean/SyriacAustralianAustrianBahamianBangladeshiBarbadianBasqueBelgianBelizeanBermudanBhutaneseBlackfeetBolivianBrazilianBritishBritish West IndianBulgarianBurmeseCajunCambodianCanadianCape VerdeanCarpatho RusynCelticCentral AmericanCentral American IndianCherokeeCheyenneChickasawChileanChineseChippewaChoctawColombianColvilleComancheCosta RicanCreeCreekCroatianCrowCubanCypriotCzechCzechoslovakianDanishDelawareDominicanDutchDutch West IndianEastern EuropeanEcuadorianEgyptianEnglishEstonianEthiopianEuropeanFijianFilipinoFinnishFrenchFrench American IndianFrench CanadianGermanGerman RussianGhanaianGreekGuamanian/ChamorroGuatemalanGuyaneseHaitianHmongHonduranHopiHoumaHungarianIcelanderIndian (Asian)IndonesianInupiatIranianIraqiIrishIroquoisIsraeliItalianJamaicanJapaneseJordanianKenyanKiowaKoreanLaotianLatvianLebaneseLiberianLithuanianLumbeeLuxembourgerMacedonianMalaysianMalteseMarshalleseMenomineeMexicanMexican American IndianMoroccanNative HawaiianNavajoNepaleseNew ZealanderNicaraguanNigerianNorthern EuropeanNorwegianOkinawanOsageOttawaPaiutePakistaniPalestinianPanamanianParaguayanPennsylvania GermanPeruvianPimaPolishPortuguesePotawatomiPuebloPuerto RicanPuget Sound SalishRomanianRussianSalvadoranSamoanScandinavianScotch-IrishScottishSeminoleSenegaleseSerbianShoshoneSierra LeoneanSiouxSlavicSlovakSloveneSomaliSouth AfricanSouth AmericanSouth American IndianSoviet UnionSpaniardSpanishSpanish AmericanSpanish American IndianSri LankanSubsaharan AfricanSudaneseSwedishSwissSyrianTaiwaneseThaiTlingit-HaidaTohono O'OdhamTonganTrinidadian and TobagonianTsimshianTurkishU.S. Virgin IslanderUgandanUkrainianUruguayanUteVenezuelanVietnameseWelshWest IndianYakamaYaquiYugoslavianYumanYup'ikZimbabwean
Immigration
NonimmigrantsImmigrantsAfghanistanAfricaAlbaniaArgentinaArmeniaAsiaAustraliaAustriaBahamasBangladeshBarbadosBelarusBelgiumBelizeBoliviaBosnia and HerzegovinaBrazilBulgariaBurma/MyanmarCabo VerdeCambodiaCameroonCanadaCaribbeanCentral AmericaChileChinaColombiaCongoCosta RicaCroatiaCubaCzechoslovakiaDenmarkDominicaDominican RepublicEastern AfricaEastern AsiaEastern EuropeEcuadorEgyptEl SalvadorEnglandEritreaEthiopiaEuropeFijiFranceGermanyGhanaGreeceGrenadaGuatemalaGuyanaHaitiHondurasHong KongHungaryIndiaIndonesiaIranIraqIrelandIsraelItalyJamaicaJapanJordanKazakhstanKenyaKoreaKuwaitLaosLatin AmericaLatviaLebanonLiberiaLithuaniaMalaysiaMexicoMicronesiaMiddle AfricaMoldovaMoroccoNepalNetherlandsNicaraguaNigeriaNorth AmericaNorth MacedoniaNorthern AfricaNorthern EuropeNorwayOceaniaPakistanPanamaPeruPhilippinesPolandPortugalRomaniaRussiaSaudi ArabiaScotlandSenegalSerbiaSierra LeoneSingaporeSomaliaSouth AfricaSouth AmericaSouth Central AsiaSouth Eastern AsiaSouthern EuropeSpainSri LankaSt. Vincent and the GrenadinesSudanSwedenSwitzerlandSyriaTaiwanThailandTrinidad and TobagoTurkeyUgandaUkraineUruguayUzbekistanVenezuelaVietnamWest IndiesWestern AfricaWestern AsiaWestern EuropeYemenZaireZimbabweAzores
Mongolian
Race
Ancestry
AfghanAfricanAlaska NativeAlaskan AthabascanAlbanianAleutAlsatianAmericanApacheArabArapahoArgentineanArmenianAssyrian/Chaldean/SyriacAustralianAustrianBahamianBangladeshiBarbadianBasqueBelgianBelizeanBermudanBhutaneseBlackfeetBolivianBrazilianBritishBritish West IndianBulgarianBurmeseCajunCambodianCanadianCape VerdeanCarpatho RusynCelticCentral AmericanCentral American IndianCherokeeCheyenneChickasawChileanChineseChippewaChoctawColombianColvilleComancheCosta RicanCreeCreekCroatianCrowCubanCypriotCzechCzechoslovakianDanishDelawareDominicanDutchDutch West IndianEastern EuropeanEcuadorianEgyptianEnglishEstonianEthiopianEuropeanFijianFilipinoFinnishFrenchFrench American IndianFrench CanadianGermanGerman RussianGhanaianGreekGuamanian/ChamorroGuatemalanGuyaneseHaitianHmongHonduranHopiHoumaHungarianIcelanderIndian (Asian)IndonesianInupiatIranianIraqiIrishIroquoisIsraeliItalianJamaicanJapaneseJordanianKenyanKiowaKoreanLaotianLatvianLebaneseLiberianLithuanianLumbeeLuxembourgerMacedonianMalaysianMalteseMarshalleseMenomineeMexicanMexican American IndianMongolianMoroccanNative HawaiianNavajoNepaleseNew ZealanderNicaraguanNigerianNorthern EuropeanNorwegianOkinawanOsageOttawaPaiutePakistaniPalestinianPanamanianParaguayanPennsylvania GermanPeruvianPimaPolishPortuguesePotawatomiPuebloPuerto RicanPuget Sound SalishRomanianRussianSalvadoranSamoanScandinavianScotch-IrishScottishSeminoleSenegaleseSerbianShoshoneSierra LeoneanSiouxSlavicSlovakSloveneSomaliSouth AfricanSouth AmericanSouth American IndianSoviet UnionSpaniardSpanishSpanish AmericanSpanish American IndianSri LankanSubsaharan AfricanSudaneseSwedishSwissSyrianTaiwaneseThaiTlingit-HaidaTohono O'OdhamTonganTrinidadian and TobagonianTsimshianTurkishU.S. Virgin IslanderUgandanUkrainianUruguayanUteVenezuelanVietnameseWelshWest IndianYakamaYaquiYugoslavianYumanYup'ikZimbabwean
Immigration
NonimmigrantsImmigrantsAfghanistanAfricaAlbaniaArgentinaArmeniaAsiaAustraliaAustriaBahamasBangladeshBarbadosBelarusBelgiumBelizeBoliviaBosnia and HerzegovinaBrazilBulgariaBurma/MyanmarCabo VerdeCambodiaCameroonCanadaCaribbeanCentral AmericaChileChinaColombiaCongoCosta RicaCroatiaCubaCzechoslovakiaDenmarkDominicaDominican RepublicEastern AfricaEastern EuropeEcuadorEgyptEl SalvadorEnglandEritreaEthiopiaEuropeFijiFranceGermanyGhanaGreeceGrenadaGuatemalaGuyanaHaitiHondurasHong KongHungaryIndiaIndonesiaIranIraqIrelandIsraelItalyJamaicaJapanJordanKazakhstanKenyaKoreaKuwaitLaosLatin AmericaLatviaLebanonLiberiaLithuaniaMalaysiaMexicoMicronesiaMiddle AfricaMoldovaMoroccoNepalNetherlandsNicaraguaNigeriaNorth AmericaNorth MacedoniaNorthern AfricaNorthern EuropeNorwayOceaniaPakistanPanamaPeruPhilippinesPolandPortugalRomaniaRussiaSaudi ArabiaScotlandSenegalSerbiaSierra LeoneSingaporeSomaliaSouth AfricaSouth AmericaSouth Central AsiaSouth Eastern AsiaSouthern EuropeSpainSri LankaSt. Vincent and the GrenadinesSudanSwedenSwitzerlandSyriaTaiwanThailandTrinidad and TobagoTurkeyUgandaUkraineUruguayUzbekistanVenezuelaVietnamWest IndiesWestern AfricaWestern AsiaWestern EuropeYemenZaireZimbabweAzores
Single Male Poverty
Income
Poverty
Unemployment
Labor Participation
Family Structure
Vehicle Availability
Education Level
Disability

Single Male Poverty Comparison

Immigrants from Eastern Asia

Mongolians

Exceptional
Exceptional
11.4%
SINGLE MALE POVERTY
100.0/ 100
METRIC RATING
32nd/ 347
METRIC RANK
12.2%
SINGLE MALE POVERTY
97.7/ 100
METRIC RATING
95th/ 347
METRIC RANK

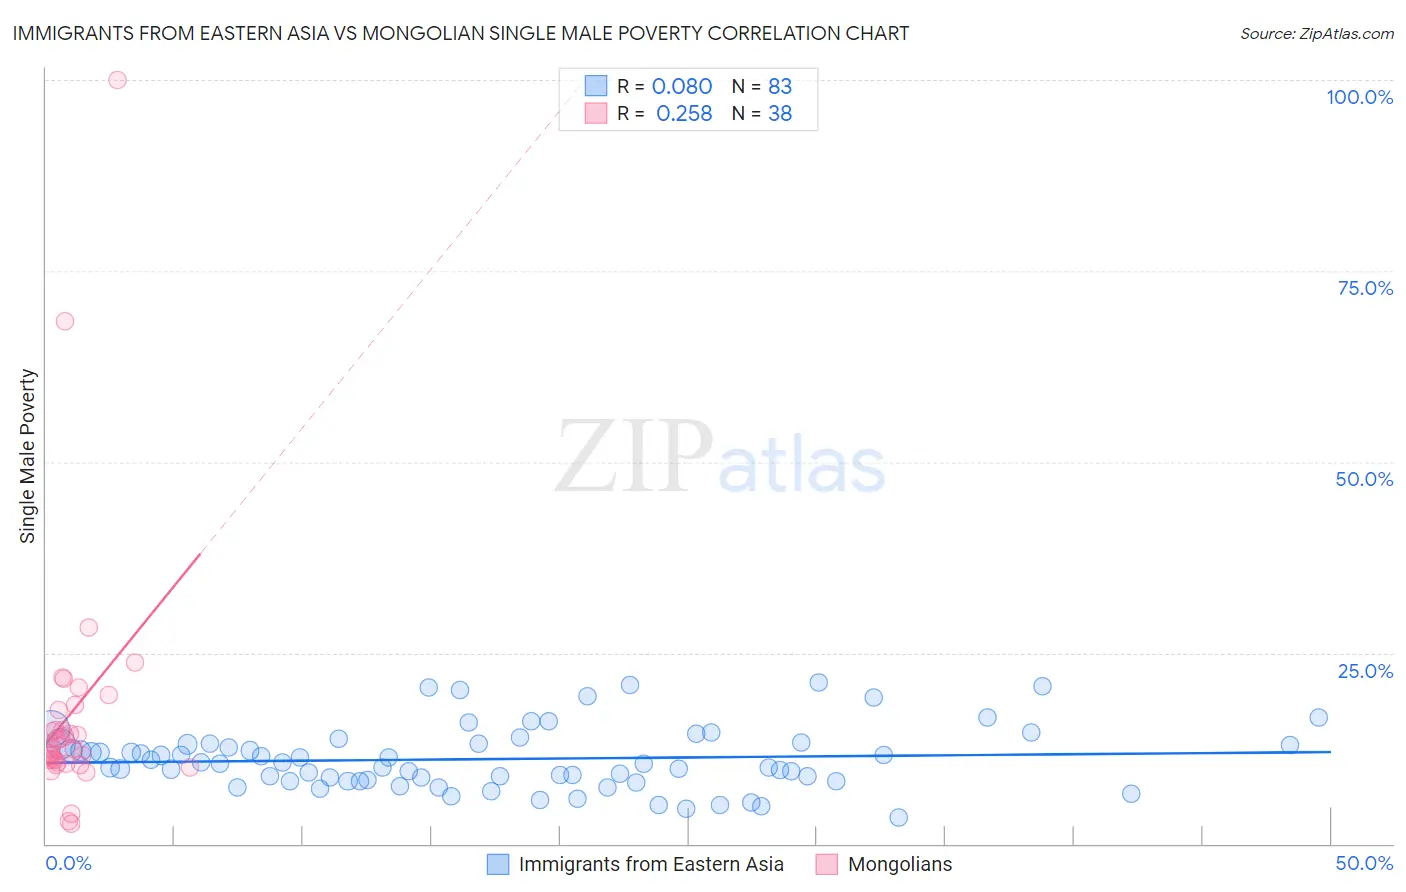
Immigrants from Eastern Asia vs Mongolian Single Male Poverty Correlation Chart

The statistical analysis conducted on geographies consisting of 427,975,999 people shows a slight positive correlation between the proportion of Immigrants from Eastern Asia and poverty level among single males in the United States with a correlation coefficient (R) of 0.080 and weighted average of 11.4%. Similarly, the statistical analysis conducted on geographies consisting of 132,546,705 people shows a weak positive correlation between the proportion of Mongolians and poverty level among single males in the United States with a correlation coefficient (R) of 0.258 and weighted average of 12.2%, a difference of 6.5%.
Immigrants from Eastern Asia vs Mongolian Single Male Poverty

Single Male Poverty Correlation Summary

MeasurementImmigrants from Eastern AsiaMongolian
Minimum3.5%2.7%
Maximum21.1%100.0%
Range17.6%97.3%
Mean11.1%17.1%
Median10.5%12.5%
Interquartile 25% (IQ1)8.2%10.7%
Interquartile 75% (IQ3)13.1%17.6%
Interquartile Range (IQR)4.9%6.9%
Standard Deviation (Sample)4.1%17.3%
Standard Deviation (Population)4.1%17.0%

Similar Demographics by Single Male Poverty

Demographics Similar to Immigrants from Eastern Asia by Single Male Poverty

In terms of single male poverty, the demographic groups most similar to Immigrants from Eastern Asia are Immigrants from Vietnam (11.4%, a difference of 0.070%), Immigrants from Iran (11.4%, a difference of 0.090%), Immigrants from Ethiopia (11.4%, a difference of 0.11%), Immigrants from South Eastern Asia (11.4%, a difference of 0.15%), and Iranian (11.4%, a difference of 0.18%).
DemographicsRating | RankSingle Male Poverty
Maltese
100.0
/100
|
#25
Exceptional
11.3%
Immigrants | Japan
100.0
/100
|
#26
Exceptional
11.3%
Immigrants | China
100.0
/100
|
#27
Exceptional
11.4%
Immigrants | Asia
100.0
/100
|
#28
Exceptional
11.4%
Immigrants | Egypt
100.0
/100
|
#29
Exceptional
11.4%
Iranians
100.0
/100
|
#30
Exceptional
11.4%
Immigrants | Iran
100.0
/100
|
#31
Exceptional
11.4%
Immigrants | Eastern Asia
100.0
/100
|
#32
Exceptional
11.4%
Immigrants | Vietnam
100.0
/100
|
#33
Exceptional
11.4%
Immigrants | Ethiopia
100.0
/100
|
#34
Exceptional
11.4%
Immigrants | South Eastern Asia
100.0
/100
|
#35
Exceptional
11.4%
Immigrants | Serbia
100.0
/100
|
#36
Exceptional
11.4%
Immigrants | Singapore
100.0
/100
|
#37
Exceptional
11.4%
Sri Lankans
100.0
/100
|
#38
Exceptional
11.5%
Soviet Union
100.0
/100
|
#39
Exceptional
11.5%

Demographics Similar to Mongolians by Single Male Poverty

In terms of single male poverty, the demographic groups most similar to Mongolians are Colombian (12.2%, a difference of 0.010%), Immigrants from Bosnia and Herzegovina (12.1%, a difference of 0.13%), Immigrants from Sweden (12.2%, a difference of 0.15%), Spanish American Indian (12.1%, a difference of 0.19%), and Immigrants from Italy (12.2%, a difference of 0.20%).
DemographicsRating | RankSingle Male Poverty
Immigrants | Eritrea
98.5
/100
|
#88
Exceptional
12.1%
Immigrants | Ireland
98.3
/100
|
#89
Exceptional
12.1%
South American Indians
98.3
/100
|
#90
Exceptional
12.1%
Immigrants | Turkey
98.2
/100
|
#91
Exceptional
12.1%
Spanish American Indians
98.0
/100
|
#92
Exceptional
12.1%
Immigrants | Bosnia and Herzegovina
97.9
/100
|
#93
Exceptional
12.1%
Colombians
97.8
/100
|
#94
Exceptional
12.2%
Mongolians
97.7
/100
|
#95
Exceptional
12.2%
Immigrants | Sweden
97.5
/100
|
#96
Exceptional
12.2%
Immigrants | Italy
97.4
/100
|
#97
Exceptional
12.2%
Guamanians/Chamorros
97.4
/100
|
#98
Exceptional
12.2%
Immigrants | Cuba
97.3
/100
|
#99
Exceptional
12.2%
Immigrants | Australia
97.1
/100
|
#100
Exceptional
12.2%
Immigrants | Latvia
97.0
/100
|
#101
Exceptional
12.2%
Immigrants | Europe
97.0
/100
|
#102
Exceptional
12.2%