Immigrants from Poland vs Swedish Male Poverty
COMPARE
Immigrants from Poland
Swedish
Male Poverty
Male Poverty Comparison
Immigrants from Poland
Swedes
9.8%
MALE POVERTY
99.5/ 100
METRIC RATING
34th/ 347
METRIC RANK
9.6%
MALE POVERTY
99.7/ 100
METRIC RATING
24th/ 347
METRIC RANK
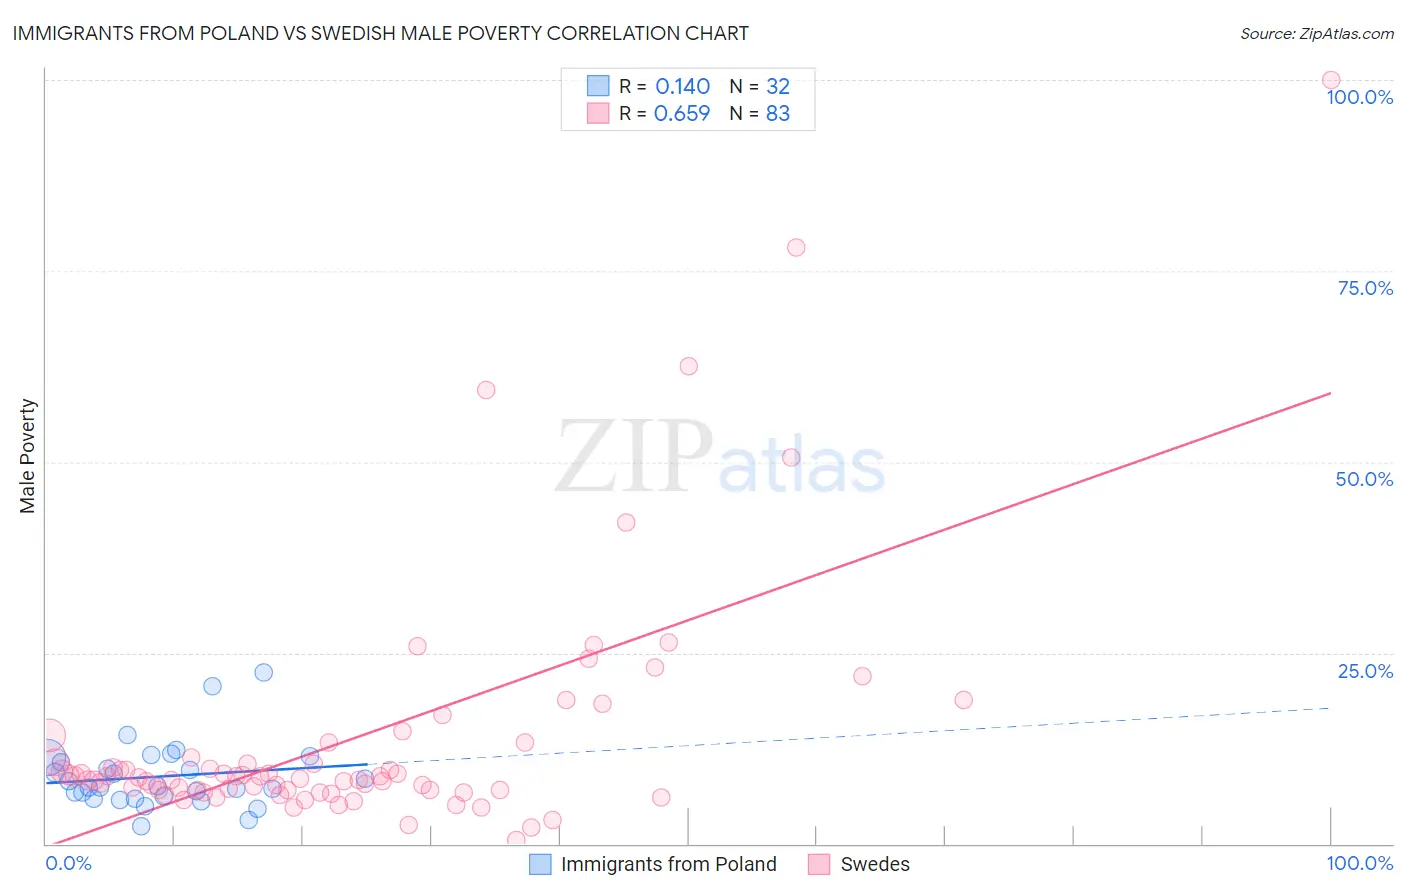
Immigrants from Poland vs Swedish Male Poverty Correlation Chart
The statistical analysis conducted on geographies consisting of 304,660,101 people shows a poor positive correlation between the proportion of Immigrants from Poland and poverty level among males in the United States with a correlation coefficient (R) of 0.140 and weighted average of 9.8%. Similarly, the statistical analysis conducted on geographies consisting of 538,008,774 people shows a significant positive correlation between the proportion of Swedes and poverty level among males in the United States with a correlation coefficient (R) of 0.659 and weighted average of 9.6%, a difference of 1.4%.
Male Poverty Correlation Summary
| Measurement | Immigrants from Poland | Swedish |
| Minimum | 2.3% | 0.53% |
| Maximum | 22.5% | 100.0% |
| Range | 20.2% | 99.5% |
| Mean | 8.8% | 13.8% |
| Median | 7.5% | 8.6% |
| Interquartile 25% (IQ1) | 6.0% | 7.0% |
| Interquartile 75% (IQ3) | 11.0% | 11.3% |
| Interquartile Range (IQR) | 4.9% | 4.3% |
| Standard Deviation (Sample) | 4.3% | 16.3% |
| Standard Deviation (Population) | 4.3% | 16.2% |
Demographics Similar to Immigrants from Poland and Swedes by Male Poverty
In terms of male poverty, the demographic groups most similar to Immigrants from Poland are Immigrants from Northern Europe (9.7%, a difference of 0.15%), Macedonian (9.7%, a difference of 0.23%), Iranian (9.8%, a difference of 0.30%), Czech (9.8%, a difference of 0.39%), and Tongan (9.7%, a difference of 0.44%). Similarly, the demographic groups most similar to Swedes are Italian (9.6%, a difference of 0.080%), Croatian (9.6%, a difference of 0.090%), Eastern European (9.6%, a difference of 0.14%), Immigrants from Scotland (9.6%, a difference of 0.34%), and Burmese (9.7%, a difference of 0.58%).
| Demographics | Rating | Rank | Male Poverty |
| Immigrants | Hong Kong | 99.7 /100 | #19 | Exceptional 9.6% |
| Latvians | 99.7 /100 | #20 | Exceptional 9.6% |
| Immigrants | Scotland | 99.7 /100 | #21 | Exceptional 9.6% |
| Croatians | 99.7 /100 | #22 | Exceptional 9.6% |
| Italians | 99.7 /100 | #23 | Exceptional 9.6% |
| Swedes | 99.7 /100 | #24 | Exceptional 9.6% |
| Eastern Europeans | 99.6 /100 | #25 | Exceptional 9.6% |
| Burmese | 99.6 /100 | #26 | Exceptional 9.7% |
| Danes | 99.6 /100 | #27 | Exceptional 9.7% |
| Immigrants | Korea | 99.6 /100 | #28 | Exceptional 9.7% |
| Greeks | 99.6 /100 | #29 | Exceptional 9.7% |
| Poles | 99.5 /100 | #30 | Exceptional 9.7% |
| Tongans | 99.5 /100 | #31 | Exceptional 9.7% |
| Macedonians | 99.5 /100 | #32 | Exceptional 9.7% |
| Immigrants | Northern Europe | 99.5 /100 | #33 | Exceptional 9.7% |
| Immigrants | Poland | 99.5 /100 | #34 | Exceptional 9.8% |
| Iranians | 99.4 /100 | #35 | Exceptional 9.8% |
| Czechs | 99.4 /100 | #36 | Exceptional 9.8% |
| Immigrants | Greece | 99.3 /100 | #37 | Exceptional 9.8% |
| Immigrants | Pakistan | 99.2 /100 | #38 | Exceptional 9.9% |
| Russians | 99.2 /100 | #39 | Exceptional 9.9% |