Colombian vs Swedish Male Poverty
COMPARE
Colombian
Swedish
Male Poverty
Male Poverty Comparison
Colombians
Swedes
11.0%
MALE POVERTY
63.0/ 100
METRIC RATING
158th/ 347
METRIC RANK
9.6%
MALE POVERTY
99.7/ 100
METRIC RATING
24th/ 347
METRIC RANK
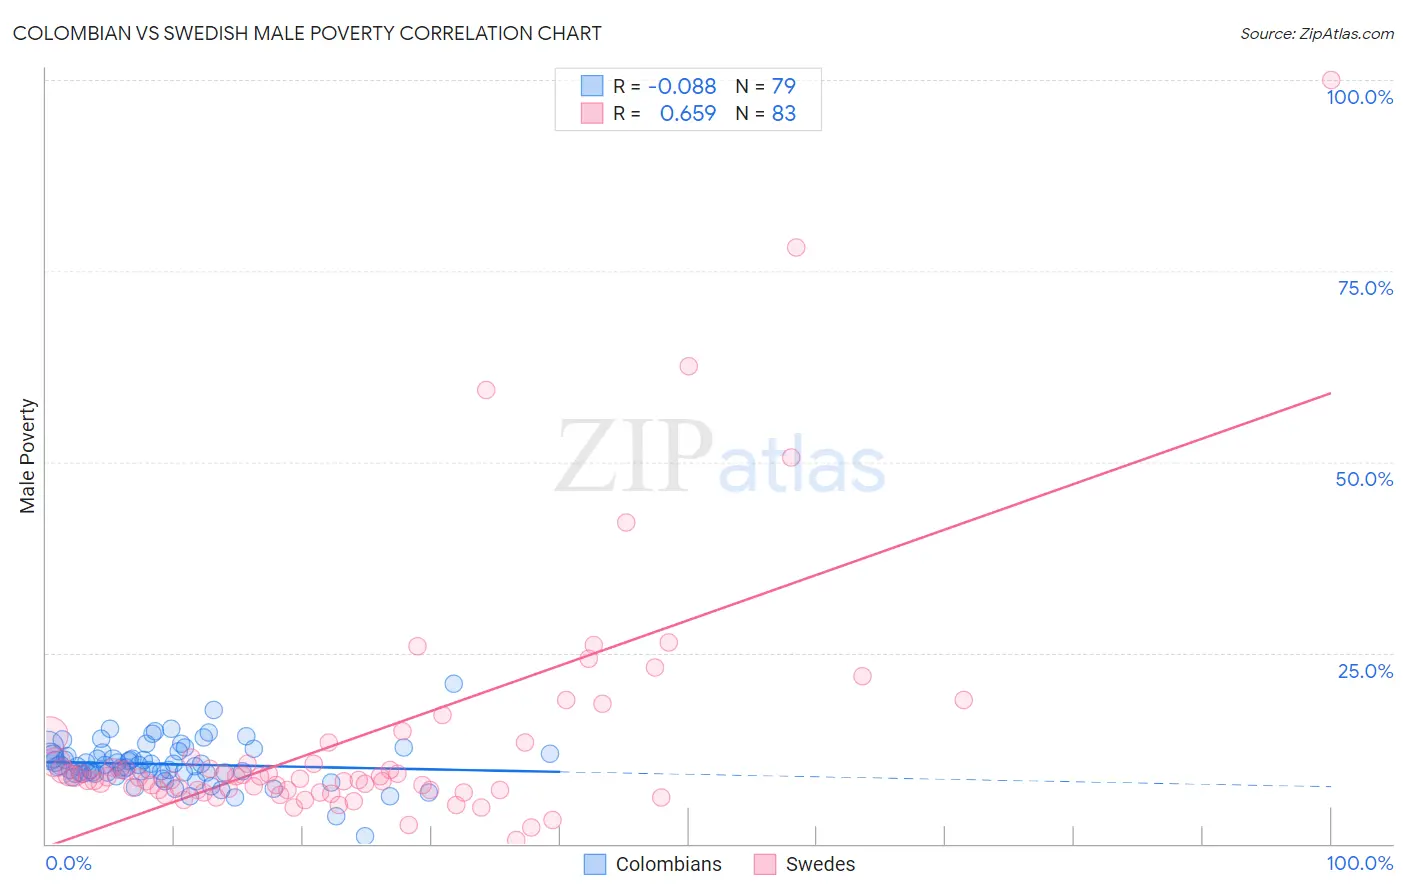
Colombian vs Swedish Male Poverty Correlation Chart
The statistical analysis conducted on geographies consisting of 419,146,336 people shows a slight negative correlation between the proportion of Colombians and poverty level among males in the United States with a correlation coefficient (R) of -0.088 and weighted average of 11.0%. Similarly, the statistical analysis conducted on geographies consisting of 538,008,774 people shows a significant positive correlation between the proportion of Swedes and poverty level among males in the United States with a correlation coefficient (R) of 0.659 and weighted average of 9.6%, a difference of 14.7%.
Male Poverty Correlation Summary
| Measurement | Colombian | Swedish |
| Minimum | 1.0% | 0.53% |
| Maximum | 21.0% | 100.0% |
| Range | 20.0% | 99.5% |
| Mean | 10.4% | 13.8% |
| Median | 10.2% | 8.6% |
| Interquartile 25% (IQ1) | 9.2% | 7.0% |
| Interquartile 75% (IQ3) | 11.8% | 11.3% |
| Interquartile Range (IQR) | 2.5% | 4.3% |
| Standard Deviation (Sample) | 2.9% | 16.3% |
| Standard Deviation (Population) | 2.9% | 16.2% |
Similar Demographics by Male Poverty
Demographics Similar to Colombians by Male Poverty
In terms of male poverty, the demographic groups most similar to Colombians are Taiwanese (11.0%, a difference of 0.030%), Scotch-Irish (11.0%, a difference of 0.080%), Costa Rican (11.0%, a difference of 0.10%), Immigrants from Malaysia (11.0%, a difference of 0.19%), and Immigrants from Kazakhstan (11.0%, a difference of 0.20%).
| Demographics | Rating | Rank | Male Poverty |
| Venezuelans | 67.4 /100 | #151 | Good 11.0% |
| Immigrants | Nepal | 67.3 /100 | #152 | Good 11.0% |
| Immigrants | Bosnia and Herzegovina | 65.2 /100 | #153 | Good 11.0% |
| Immigrants | Kazakhstan | 64.8 /100 | #154 | Good 11.0% |
| Immigrants | Malaysia | 64.7 /100 | #155 | Good 11.0% |
| Costa Ricans | 63.9 /100 | #156 | Good 11.0% |
| Scotch-Irish | 63.7 /100 | #157 | Good 11.0% |
| Colombians | 63.0 /100 | #158 | Good 11.0% |
| Taiwanese | 62.7 /100 | #159 | Good 11.0% |
| Soviet Union | 60.3 /100 | #160 | Good 11.1% |
| Immigrants | Northern Africa | 59.7 /100 | #161 | Average 11.1% |
| Immigrants | Chile | 57.4 /100 | #162 | Average 11.1% |
| Whites/Caucasians | 56.7 /100 | #163 | Average 11.1% |
| Ethiopians | 56.7 /100 | #164 | Average 11.1% |
| Immigrants | Spain | 55.5 /100 | #165 | Average 11.1% |
Demographics Similar to Swedes by Male Poverty
In terms of male poverty, the demographic groups most similar to Swedes are Italian (9.6%, a difference of 0.080%), Croatian (9.6%, a difference of 0.090%), Eastern European (9.6%, a difference of 0.14%), Immigrants from Scotland (9.6%, a difference of 0.34%), and Burmese (9.7%, a difference of 0.58%).
| Demographics | Rating | Rank | Male Poverty |
| Norwegians | 99.8 /100 | #17 | Exceptional 9.5% |
| Lithuanians | 99.8 /100 | #18 | Exceptional 9.5% |
| Immigrants | Hong Kong | 99.7 /100 | #19 | Exceptional 9.6% |
| Latvians | 99.7 /100 | #20 | Exceptional 9.6% |
| Immigrants | Scotland | 99.7 /100 | #21 | Exceptional 9.6% |
| Croatians | 99.7 /100 | #22 | Exceptional 9.6% |
| Italians | 99.7 /100 | #23 | Exceptional 9.6% |
| Swedes | 99.7 /100 | #24 | Exceptional 9.6% |
| Eastern Europeans | 99.6 /100 | #25 | Exceptional 9.6% |
| Burmese | 99.6 /100 | #26 | Exceptional 9.7% |
| Danes | 99.6 /100 | #27 | Exceptional 9.7% |
| Immigrants | Korea | 99.6 /100 | #28 | Exceptional 9.7% |
| Greeks | 99.6 /100 | #29 | Exceptional 9.7% |
| Poles | 99.5 /100 | #30 | Exceptional 9.7% |
| Tongans | 99.5 /100 | #31 | Exceptional 9.7% |