Immigrants from Dominican Republic vs Swedish Unemployment Among Ages 55 to 59 years

COMPARE

Immigrants from Dominican Republic
Race
Ancestry
AfghanAfricanAlaska NativeAlaskan AthabascanAlbanianAleutAlsatianAmericanApacheArabArapahoArgentineanArmenianAssyrian/Chaldean/SyriacAustralianAustrianBahamianBangladeshiBarbadianBasqueBelgianBelizeanBermudanBhutaneseBlackfeetBolivianBrazilianBritishBritish West IndianBulgarianBurmeseCajunCambodianCanadianCape VerdeanCarpatho RusynCelticCentral AmericanCentral American IndianCherokeeCheyenneChickasawChileanChineseChippewaChoctawColombianColvilleComancheCosta RicanCreeCreekCroatianCrowCubanCypriotCzechCzechoslovakianDanishDelawareDominicanDutchDutch West IndianEastern EuropeanEcuadorianEgyptianEnglishEstonianEthiopianEuropeanFijianFilipinoFinnishFrenchFrench American IndianFrench CanadianGermanGerman RussianGhanaianGreekGuamanian/ChamorroGuatemalanGuyaneseHaitianHmongHonduranHopiHoumaHungarianIcelanderIndian (Asian)IndonesianInupiatIranianIraqiIrishIroquoisIsraeliItalianJamaicanJapaneseJordanianKenyanKiowaKoreanLaotianLatvianLebaneseLiberianLithuanianLumbeeLuxembourgerMacedonianMalaysianMalteseMarshalleseMenomineeMexicanMexican American IndianMongolianMoroccanNative HawaiianNavajoNepaleseNew ZealanderNicaraguanNigerianNorthern EuropeanNorwegianOkinawanOsageOttawaPaiutePakistaniPalestinianPanamanianParaguayanPennsylvania GermanPeruvianPimaPolishPortuguesePotawatomiPuebloPuerto RicanPuget Sound SalishRomanianRussianSalvadoranSamoanScandinavianScotch-IrishScottishSeminoleSenegaleseSerbianShoshoneSierra LeoneanSiouxSlavicSlovakSloveneSomaliSouth AfricanSouth AmericanSouth American IndianSoviet UnionSpaniardSpanishSpanish AmericanSpanish American IndianSri LankanSubsaharan AfricanSudaneseSwissSyrianTaiwaneseThaiTlingit-HaidaTohono O'OdhamTonganTrinidadian and TobagonianTsimshianTurkishU.S. Virgin IslanderUgandanUkrainianUruguayanUteVenezuelanVietnameseWelshWest IndianYakamaYaquiYugoslavianYumanYup'ikZimbabwean
Immigration
NonimmigrantsImmigrantsAfghanistanAfricaAlbaniaArgentinaArmeniaAsiaAustraliaAustriaBahamasBangladeshBarbadosBelarusBelgiumBelizeBoliviaBosnia and HerzegovinaBrazilBulgariaBurma/MyanmarCabo VerdeCambodiaCameroonCanadaCaribbeanCentral AmericaChileChinaColombiaCongoCosta RicaCroatiaCubaCzechoslovakiaDenmarkDominicaDominican RepublicEastern AfricaEastern AsiaEastern EuropeEcuadorEgyptEl SalvadorEnglandEritreaEthiopiaEuropeFijiFranceGermanyGhanaGreeceGrenadaGuatemalaGuyanaHaitiHondurasHong KongHungaryIndiaIndonesiaIranIraqIrelandIsraelItalyJamaicaJapanJordanKazakhstanKenyaKoreaKuwaitLaosLatin AmericaLatviaLebanonLiberiaLithuaniaMalaysiaMexicoMicronesiaMiddle AfricaMoldovaMoroccoNepalNetherlandsNicaraguaNigeriaNorth AmericaNorth MacedoniaNorthern AfricaNorthern EuropeNorwayOceaniaPakistanPanamaPeruPhilippinesPolandPortugalRomaniaRussiaSaudi ArabiaScotlandSenegalSerbiaSierra LeoneSingaporeSomaliaSouth AfricaSouth AmericaSouth Central AsiaSouth Eastern AsiaSouthern EuropeSpainSri LankaSt. Vincent and the GrenadinesSudanSwedenSwitzerlandSyriaTaiwanThailandTrinidad and TobagoTurkeyUgandaUkraineUruguayUzbekistanVenezuelaVietnamWest IndiesWestern AfricaWestern AsiaWestern EuropeYemenZaireZimbabweAzores
Swedish
Race
Ancestry
AfghanAfricanAlaska NativeAlaskan AthabascanAlbanianAleutAlsatianAmericanApacheArabArapahoArgentineanArmenianAssyrian/Chaldean/SyriacAustralianAustrianBahamianBangladeshiBarbadianBasqueBelgianBelizeanBermudanBhutaneseBlackfeetBolivianBrazilianBritishBritish West IndianBulgarianBurmeseCajunCambodianCanadianCape VerdeanCarpatho RusynCelticCentral AmericanCentral American IndianCherokeeCheyenneChickasawChileanChineseChippewaChoctawColombianColvilleComancheCosta RicanCreeCreekCroatianCrowCubanCypriotCzechCzechoslovakianDanishDelawareDominicanDutchDutch West IndianEastern EuropeanEcuadorianEgyptianEnglishEstonianEthiopianEuropeanFijianFilipinoFinnishFrenchFrench American IndianFrench CanadianGermanGerman RussianGhanaianGreekGuamanian/ChamorroGuatemalanGuyaneseHaitianHmongHonduranHopiHoumaHungarianIcelanderIndian (Asian)IndonesianInupiatIranianIraqiIrishIroquoisIsraeliItalianJamaicanJapaneseJordanianKenyanKiowaKoreanLaotianLatvianLebaneseLiberianLithuanianLumbeeLuxembourgerMacedonianMalaysianMalteseMarshalleseMenomineeMexicanMexican American IndianMongolianMoroccanNative HawaiianNavajoNepaleseNew ZealanderNicaraguanNigerianNorthern EuropeanNorwegianOkinawanOsageOttawaPaiutePakistaniPalestinianPanamanianParaguayanPennsylvania GermanPeruvianPimaPolishPortuguesePotawatomiPuebloPuerto RicanPuget Sound SalishRomanianRussianSalvadoranSamoanScandinavianScotch-IrishScottishSeminoleSenegaleseSerbianShoshoneSierra LeoneanSiouxSlavicSlovakSloveneSomaliSouth AfricanSouth AmericanSouth American IndianSoviet UnionSpaniardSpanishSpanish AmericanSpanish American IndianSri LankanSubsaharan AfricanSudaneseSwedishSwissSyrianTaiwaneseThaiTlingit-HaidaTohono O'OdhamTonganTrinidadian and TobagonianTsimshianTurkishU.S. Virgin IslanderUgandanUkrainianUruguayanUteVenezuelanVietnameseWelshWest IndianYakamaYaquiYugoslavianYumanYup'ikZimbabwean
Immigration
NonimmigrantsImmigrantsAfghanistanAfricaAlbaniaArgentinaArmeniaAsiaAustraliaAustriaBahamasBangladeshBarbadosBelarusBelgiumBelizeBoliviaBosnia and HerzegovinaBrazilBulgariaBurma/MyanmarCabo VerdeCambodiaCameroonCanadaCaribbeanCentral AmericaChileChinaColombiaCongoCosta RicaCroatiaCubaCzechoslovakiaDenmarkDominicaEastern AfricaEastern AsiaEastern EuropeEcuadorEgyptEl SalvadorEnglandEritreaEthiopiaEuropeFijiFranceGermanyGhanaGreeceGrenadaGuatemalaGuyanaHaitiHondurasHong KongHungaryIndiaIndonesiaIranIraqIrelandIsraelItalyJamaicaJapanJordanKazakhstanKenyaKoreaKuwaitLaosLatin AmericaLatviaLebanonLiberiaLithuaniaMalaysiaMexicoMicronesiaMiddle AfricaMoldovaMoroccoNepalNetherlandsNicaraguaNigeriaNorth AmericaNorth MacedoniaNorthern AfricaNorthern EuropeNorwayOceaniaPakistanPanamaPeruPhilippinesPolandPortugalRomaniaRussiaSaudi ArabiaScotlandSenegalSerbiaSierra LeoneSingaporeSomaliaSouth AfricaSouth AmericaSouth Central AsiaSouth Eastern AsiaSouthern EuropeSpainSri LankaSt. Vincent and the GrenadinesSudanSwedenSwitzerlandSyriaTaiwanThailandTrinidad and TobagoTurkeyUgandaUkraineUruguayUzbekistanVenezuelaVietnamWest IndiesWestern AfricaWestern AsiaWestern EuropeYemenZaireZimbabweAzores
Unemployment Among Ages 55 to 59 years
Income
Poverty
Unemployment
Labor Participation
Family Structure
Vehicle Availability
Education Level
Disability

Unemployment Among Ages 55 to 59 years Comparison

Immigrants from Dominican Republic

Swedes

Tragic
Exceptional
6.3%
UNEMPLOYMENT AMONG AGES 55 TO 59 YEARS
0.0/ 100
METRIC RATING
331st/ 347
METRIC RANK
4.4%
UNEMPLOYMENT AMONG AGES 55 TO 59 YEARS
100.0/ 100
METRIC RATING
20th/ 347
METRIC RANK

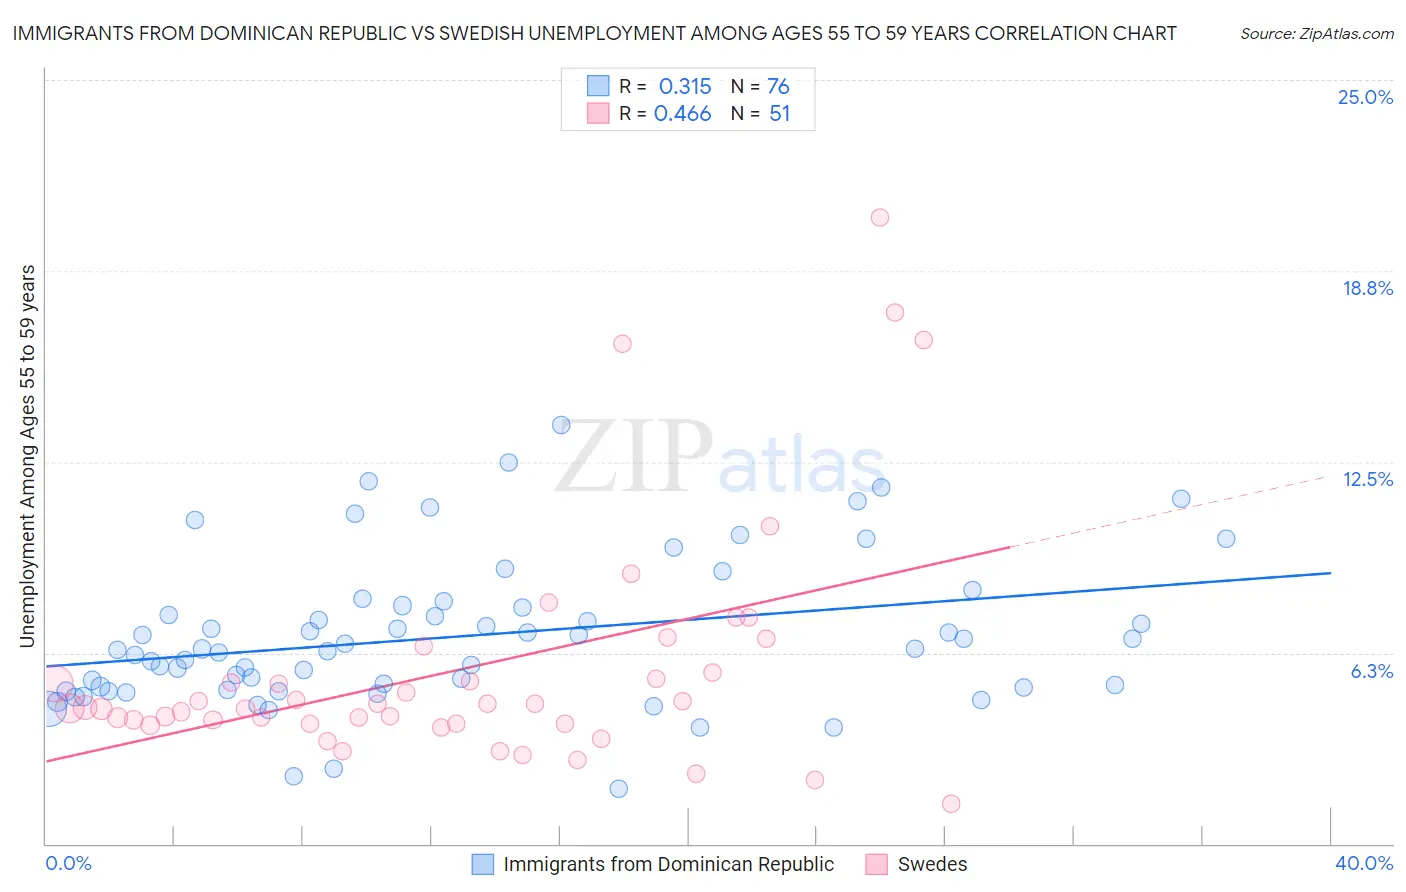
Immigrants from Dominican Republic vs Swedish Unemployment Among Ages 55 to 59 years Correlation Chart

The statistical analysis conducted on geographies consisting of 261,117,923 people shows a mild positive correlation between the proportion of Immigrants from Dominican Republic and unemployment rate among population between the ages 55 and 59 in the United States with a correlation coefficient (R) of 0.315 and weighted average of 6.3%. Similarly, the statistical analysis conducted on geographies consisting of 467,636,528 people shows a moderate positive correlation between the proportion of Swedes and unemployment rate among population between the ages 55 and 59 in the United States with a correlation coefficient (R) of 0.466 and weighted average of 4.4%, a difference of 42.6%.
Immigrants from Dominican Republic vs Swedish Unemployment Among Ages 55 to 59 years

Unemployment Among Ages 55 to 59 years Correlation Summary

MeasurementImmigrants from Dominican RepublicSwedish
Minimum1.8%1.3%
Maximum13.7%20.5%
Range11.9%19.2%
Mean6.8%5.7%
Median6.4%4.5%
Interquartile 25% (IQ1)5.1%3.9%
Interquartile 75% (IQ3)7.8%5.6%
Interquartile Range (IQR)2.7%1.7%
Standard Deviation (Sample)2.4%3.9%
Standard Deviation (Population)2.4%3.9%

Similar Demographics by Unemployment Among Ages 55 to 59 years

Demographics Similar to Immigrants from Dominican Republic by Unemployment Among Ages 55 to 59 years

In terms of unemployment among ages 55 to 59 years, the demographic groups most similar to Immigrants from Dominican Republic are Alaska Native (6.2%, a difference of 0.68%), Dominican (6.2%, a difference of 1.1%), Aleut (6.4%, a difference of 2.4%), Yuman (6.1%, a difference of 2.6%), and Arapaho (6.1%, a difference of 3.8%).
DemographicsRating | RankUnemployment Among Ages 55 to 59 years
Vietnamese
0.0
/100
|
#324
Tragic
5.9%
Immigrants | Armenia
0.0
/100
|
#325
Tragic
6.0%
Natives/Alaskans
0.0
/100
|
#326
Tragic
6.0%
Arapaho
0.0
/100
|
#327
Tragic
6.1%
Yuman
0.0
/100
|
#328
Tragic
6.1%
Dominicans
0.0
/100
|
#329
Tragic
6.2%
Alaska Natives
0.0
/100
|
#330
Tragic
6.2%
Immigrants | Dominican Republic
0.0
/100
|
#331
Tragic
6.3%
Aleuts
0.0
/100
|
#332
Tragic
6.4%
Pima
0.0
/100
|
#333
Tragic
6.6%
Pueblo
0.0
/100
|
#334
Tragic
6.7%
Colville
0.0
/100
|
#335
Tragic
6.7%
Navajo
0.0
/100
|
#336
Tragic
6.7%
Paiute
0.0
/100
|
#337
Tragic
6.8%
Immigrants | Yemen
0.0
/100
|
#338
Tragic
6.9%

Demographics Similar to Swedes by Unemployment Among Ages 55 to 59 years

In terms of unemployment among ages 55 to 59 years, the demographic groups most similar to Swedes are Chinese (4.4%, a difference of 0.12%), Puget Sound Salish (4.4%, a difference of 0.15%), Immigrants from Somalia (4.4%, a difference of 0.22%), Immigrants from Burma/Myanmar (4.4%, a difference of 0.24%), and Kenyan (4.4%, a difference of 0.50%).
DemographicsRating | RankUnemployment Among Ages 55 to 59 years
Indonesians
100.0
/100
|
#13
Exceptional
4.3%
Immigrants | India
100.0
/100
|
#14
Exceptional
4.3%
Bulgarians
100.0
/100
|
#15
Exceptional
4.3%
Somalis
100.0
/100
|
#16
Exceptional
4.4%
Czechs
100.0
/100
|
#17
Exceptional
4.4%
Immigrants | Somalia
100.0
/100
|
#18
Exceptional
4.4%
Chinese
100.0
/100
|
#19
Exceptional
4.4%
Swedes
100.0
/100
|
#20
Exceptional
4.4%
Puget Sound Salish
100.0
/100
|
#21
Exceptional
4.4%
Immigrants | Burma/Myanmar
100.0
/100
|
#22
Exceptional
4.4%
Kenyans
100.0
/100
|
#23
Exceptional
4.4%
Jordanians
100.0
/100
|
#24
Exceptional
4.4%
Immigrants | Eritrea
100.0
/100
|
#25
Exceptional
4.4%
Scandinavians
99.9
/100
|
#26
Exceptional
4.5%
Immigrants | Zimbabwe
99.9
/100
|
#27
Exceptional
4.5%