Immigrants from Dominican Republic vs Marshallese Single Mother Poverty
COMPARE
Immigrants from Dominican Republic
Marshallese
Single Mother Poverty
Single Mother Poverty Comparison
Immigrants from Dominican Republic
Marshallese
34.4%
SINGLE MOTHER POVERTY
0.0/ 100
METRIC RATING
313th/ 347
METRIC RANK
32.1%
SINGLE MOTHER POVERTY
0.0/ 100
METRIC RATING
279th/ 347
METRIC RANK
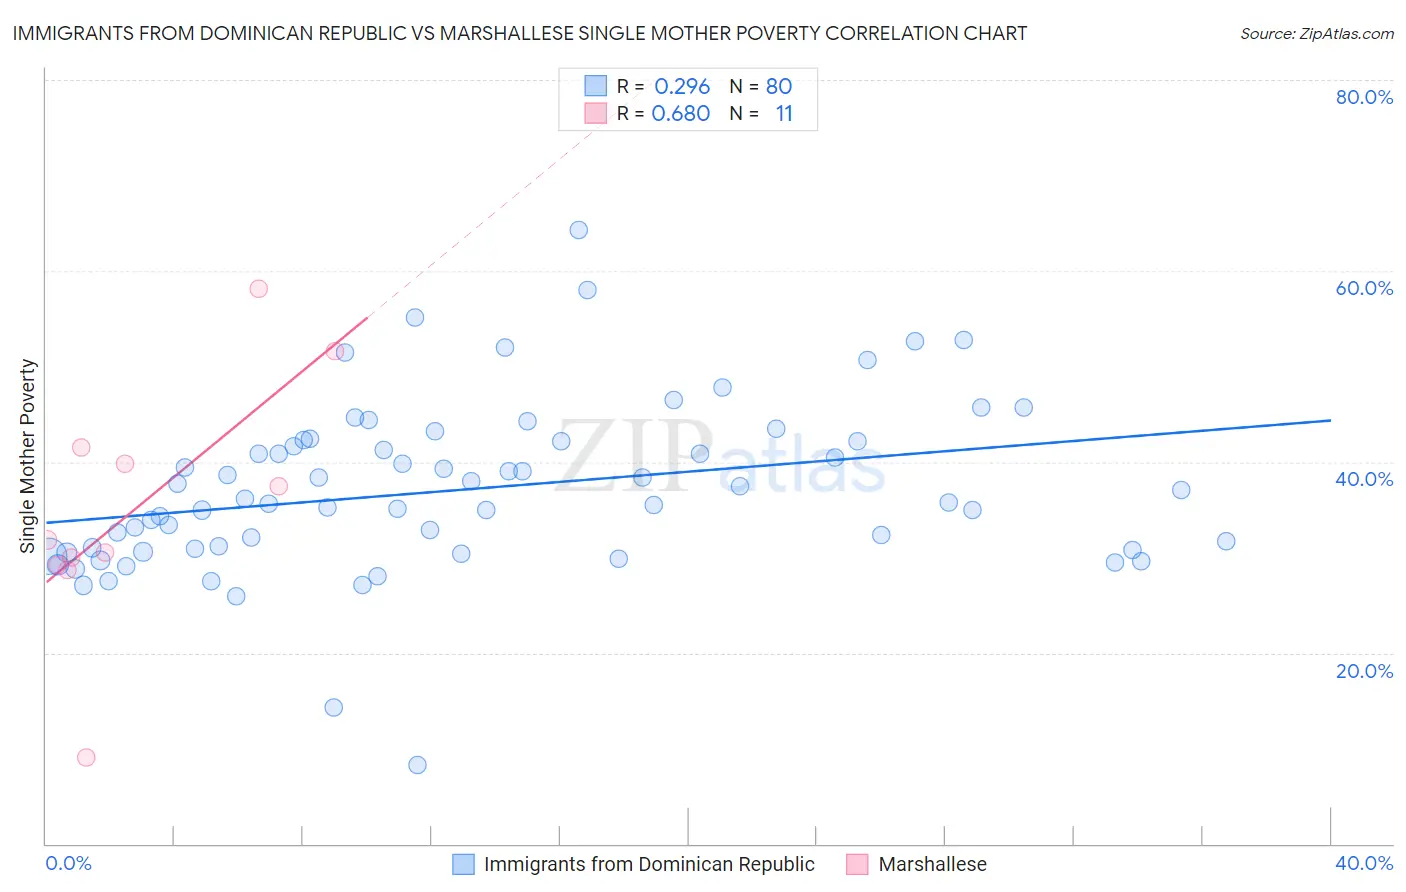
Immigrants from Dominican Republic vs Marshallese Single Mother Poverty Correlation Chart
The statistical analysis conducted on geographies consisting of 269,699,812 people shows a weak positive correlation between the proportion of Immigrants from Dominican Republic and poverty level among single mothers in the United States with a correlation coefficient (R) of 0.296 and weighted average of 34.4%. Similarly, the statistical analysis conducted on geographies consisting of 14,718,372 people shows a significant positive correlation between the proportion of Marshallese and poverty level among single mothers in the United States with a correlation coefficient (R) of 0.680 and weighted average of 32.1%, a difference of 7.0%.
Single Mother Poverty Correlation Summary
| Measurement | Immigrants from Dominican Republic | Marshallese |
| Minimum | 8.3% | 9.1% |
| Maximum | 64.2% | 58.1% |
| Range | 56.0% | 49.0% |
| Mean | 37.1% | 35.3% |
| Median | 36.0% | 31.9% |
| Interquartile 25% (IQ1) | 30.8% | 29.2% |
| Interquartile 75% (IQ3) | 42.1% | 41.5% |
| Interquartile Range (IQR) | 11.3% | 12.3% |
| Standard Deviation (Sample) | 8.9% | 13.0% |
| Standard Deviation (Population) | 8.9% | 12.4% |
Similar Demographics by Single Mother Poverty
Demographics Similar to Immigrants from Dominican Republic by Single Mother Poverty
In terms of single mother poverty, the demographic groups most similar to Immigrants from Dominican Republic are Central American Indian (34.3%, a difference of 0.080%), Alsatian (34.3%, a difference of 0.16%), Chickasaw (34.4%, a difference of 0.17%), Hopi (34.5%, a difference of 0.25%), and Dominican (34.5%, a difference of 0.37%).
| Demographics | Rating | Rank | Single Mother Poverty |
| Immigrants | Congo | 0.0 /100 | #306 | Tragic 33.8% |
| Comanche | 0.0 /100 | #307 | Tragic 33.9% |
| Immigrants | Mexico | 0.0 /100 | #308 | Tragic 34.0% |
| Potawatomi | 0.0 /100 | #309 | Tragic 34.1% |
| Hondurans | 0.0 /100 | #310 | Tragic 34.2% |
| Alsatians | 0.0 /100 | #311 | Tragic 34.3% |
| Central American Indians | 0.0 /100 | #312 | Tragic 34.3% |
| Immigrants | Dominican Republic | 0.0 /100 | #313 | Tragic 34.4% |
| Chickasaw | 0.0 /100 | #314 | Tragic 34.4% |
| Hopi | 0.0 /100 | #315 | Tragic 34.5% |
| Dominicans | 0.0 /100 | #316 | Tragic 34.5% |
| Cherokee | 0.0 /100 | #317 | Tragic 34.5% |
| Immigrants | Honduras | 0.0 /100 | #318 | Tragic 34.7% |
| Chippewa | 0.0 /100 | #319 | Tragic 34.8% |
| Iroquois | 0.0 /100 | #320 | Tragic 34.8% |
Demographics Similar to Marshallese by Single Mother Poverty
In terms of single mother poverty, the demographic groups most similar to Marshallese are Nonimmigrants (32.2%, a difference of 0.22%), Cree (32.2%, a difference of 0.24%), Immigrants from the Azores (32.2%, a difference of 0.36%), Immigrants from Zaire (32.0%, a difference of 0.40%), and Spanish American (32.3%, a difference of 0.61%).
| Demographics | Rating | Rank | Single Mother Poverty |
| Immigrants | Micronesia | 0.1 /100 | #272 | Tragic 31.6% |
| Fijians | 0.1 /100 | #273 | Tragic 31.6% |
| Bangladeshis | 0.1 /100 | #274 | Tragic 31.7% |
| Central Americans | 0.1 /100 | #275 | Tragic 31.8% |
| Delaware | 0.0 /100 | #276 | Tragic 31.8% |
| Mexican American Indians | 0.0 /100 | #277 | Tragic 31.9% |
| Immigrants | Zaire | 0.0 /100 | #278 | Tragic 32.0% |
| Marshallese | 0.0 /100 | #279 | Tragic 32.1% |
| Immigrants | Nonimmigrants | 0.0 /100 | #280 | Tragic 32.2% |
| Cree | 0.0 /100 | #281 | Tragic 32.2% |
| Immigrants | Azores | 0.0 /100 | #282 | Tragic 32.2% |
| Spanish Americans | 0.0 /100 | #283 | Tragic 32.3% |
| Indonesians | 0.0 /100 | #284 | Tragic 32.4% |
| Immigrants | Latin America | 0.0 /100 | #285 | Tragic 32.4% |
| Yup'ik | 0.0 /100 | #286 | Tragic 32.5% |