Immigrants from Dominican Republic vs Costa Rican Single Father Poverty
COMPARE
Immigrants from Dominican Republic
Costa Rican
Single Father Poverty
Single Father Poverty Comparison
Immigrants from Dominican Republic
Costa Ricans
18.4%
SINGLE FATHER POVERTY
0.0/ 100
METRIC RATING
300th/ 347
METRIC RANK
16.3%
SINGLE FATHER POVERTY
53.6/ 100
METRIC RATING
168th/ 347
METRIC RANK
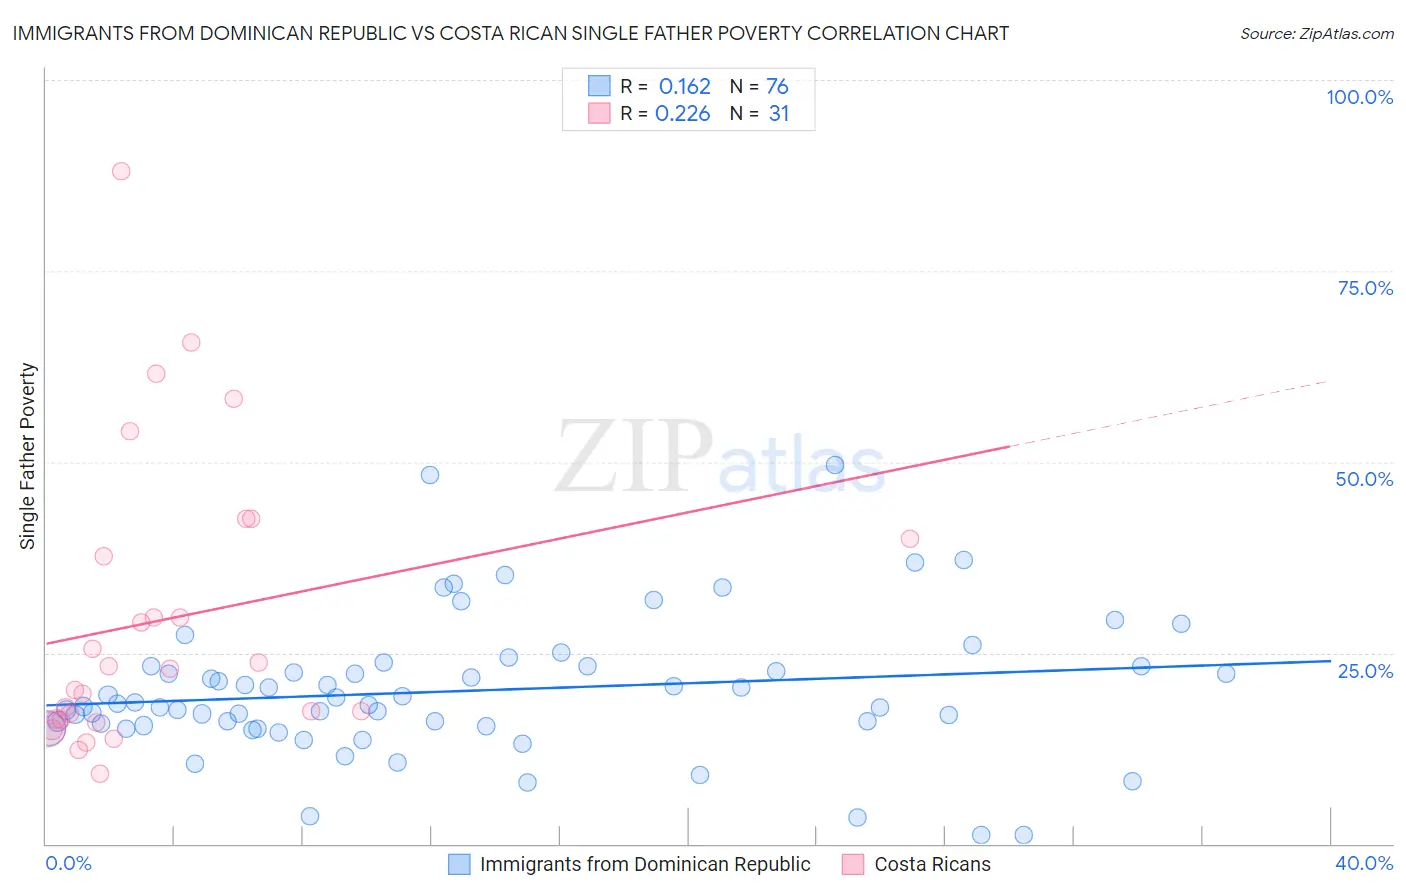
Immigrants from Dominican Republic vs Costa Rican Single Father Poverty Correlation Chart
The statistical analysis conducted on geographies consisting of 226,907,636 people shows a poor positive correlation between the proportion of Immigrants from Dominican Republic and poverty level among single fathers in the United States with a correlation coefficient (R) of 0.162 and weighted average of 18.4%. Similarly, the statistical analysis conducted on geographies consisting of 214,282,410 people shows a weak positive correlation between the proportion of Costa Ricans and poverty level among single fathers in the United States with a correlation coefficient (R) of 0.226 and weighted average of 16.3%, a difference of 13.2%.
Single Father Poverty Correlation Summary
| Measurement | Immigrants from Dominican Republic | Costa Rican |
| Minimum | 1.2% | 9.2% |
| Maximum | 49.7% | 88.0% |
| Range | 48.4% | 78.8% |
| Mean | 20.0% | 29.4% |
| Median | 18.2% | 23.0% |
| Interquartile 25% (IQ1) | 15.4% | 16.2% |
| Interquartile 75% (IQ3) | 23.2% | 40.0% |
| Interquartile Range (IQR) | 7.8% | 23.8% |
| Standard Deviation (Sample) | 9.0% | 18.9% |
| Standard Deviation (Population) | 9.0% | 18.6% |
Similar Demographics by Single Father Poverty
Demographics Similar to Immigrants from Dominican Republic by Single Father Poverty
In terms of single father poverty, the demographic groups most similar to Immigrants from Dominican Republic are Hungarian (18.5%, a difference of 0.22%), White/Caucasian (18.4%, a difference of 0.32%), Comanche (18.5%, a difference of 0.32%), Celtic (18.5%, a difference of 0.37%), and Ute (18.5%, a difference of 0.51%).
| Demographics | Rating | Rank | Single Father Poverty |
| Alaska Natives | 0.0 /100 | #293 | Tragic 18.1% |
| U.S. Virgin Islanders | 0.0 /100 | #294 | Tragic 18.1% |
| Yakama | 0.0 /100 | #295 | Tragic 18.1% |
| Seminole | 0.0 /100 | #296 | Tragic 18.1% |
| French | 0.0 /100 | #297 | Tragic 18.2% |
| Africans | 0.0 /100 | #298 | Tragic 18.3% |
| Whites/Caucasians | 0.0 /100 | #299 | Tragic 18.4% |
| Immigrants | Dominican Republic | 0.0 /100 | #300 | Tragic 18.4% |
| Hungarians | 0.0 /100 | #301 | Tragic 18.5% |
| Comanche | 0.0 /100 | #302 | Tragic 18.5% |
| Celtics | 0.0 /100 | #303 | Tragic 18.5% |
| Ute | 0.0 /100 | #304 | Tragic 18.5% |
| Blackfeet | 0.0 /100 | #305 | Tragic 18.5% |
| Scotch-Irish | 0.0 /100 | #306 | Tragic 18.6% |
| French Canadians | 0.0 /100 | #307 | Tragic 18.6% |
Demographics Similar to Costa Ricans by Single Father Poverty
In terms of single father poverty, the demographic groups most similar to Costa Ricans are Yugoslavian (16.3%, a difference of 0.010%), Northern European (16.3%, a difference of 0.040%), Immigrants from Europe (16.3%, a difference of 0.050%), Scandinavian (16.3%, a difference of 0.060%), and Guyanese (16.3%, a difference of 0.070%).
| Demographics | Rating | Rank | Single Father Poverty |
| Estonians | 56.7 /100 | #161 | Average 16.2% |
| Ugandans | 55.9 /100 | #162 | Average 16.3% |
| Immigrants | Costa Rica | 55.7 /100 | #163 | Average 16.3% |
| Guyanese | 55.2 /100 | #164 | Average 16.3% |
| Immigrants | Bangladesh | 55.1 /100 | #165 | Average 16.3% |
| Immigrants | Europe | 54.8 /100 | #166 | Average 16.3% |
| Yugoslavians | 53.9 /100 | #167 | Average 16.3% |
| Costa Ricans | 53.6 /100 | #168 | Average 16.3% |
| Northern Europeans | 52.8 /100 | #169 | Average 16.3% |
| Scandinavians | 52.3 /100 | #170 | Average 16.3% |
| Immigrants | Morocco | 50.7 /100 | #171 | Average 16.3% |
| Immigrants | Sierra Leone | 50.1 /100 | #172 | Average 16.3% |
| Immigrants | St. Vincent and the Grenadines | 50.0 /100 | #173 | Average 16.3% |
| Swedes | 50.0 /100 | #174 | Average 16.3% |
| Immigrants | Ecuador | 49.7 /100 | #175 | Average 16.3% |