Immigrants from Dominican Republic vs Nigerian Single Father Poverty
COMPARE
Immigrants from Dominican Republic
Nigerian
Single Father Poverty
Single Father Poverty Comparison
Immigrants from Dominican Republic
Nigerians
18.4%
SINGLE FATHER POVERTY
0.0/ 100
METRIC RATING
300th/ 347
METRIC RANK
16.1%
SINGLE FATHER POVERTY
76.8/ 100
METRIC RATING
148th/ 347
METRIC RANK
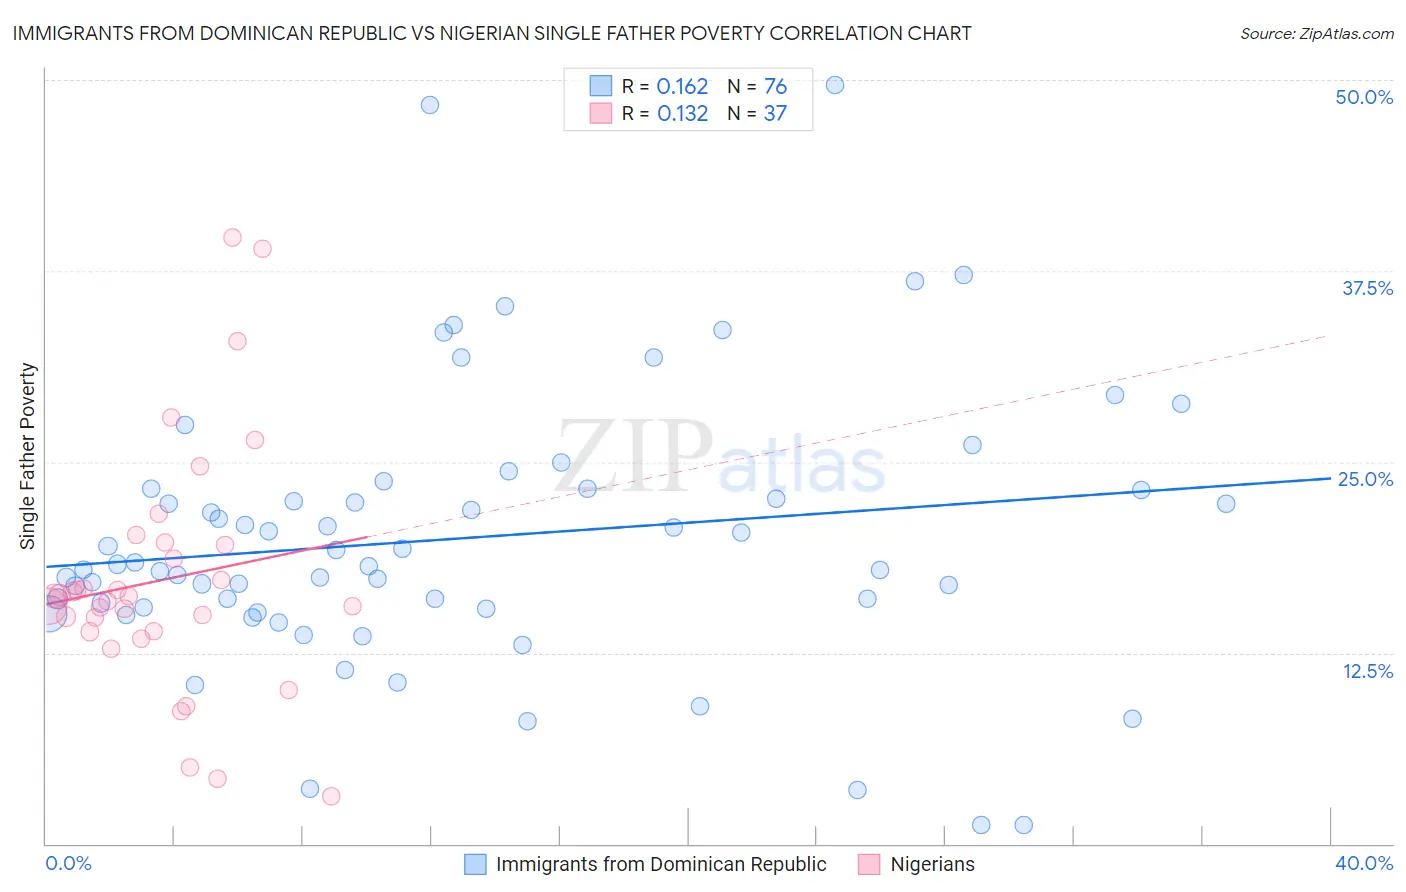
Immigrants from Dominican Republic vs Nigerian Single Father Poverty Correlation Chart
The statistical analysis conducted on geographies consisting of 226,907,636 people shows a poor positive correlation between the proportion of Immigrants from Dominican Republic and poverty level among single fathers in the United States with a correlation coefficient (R) of 0.162 and weighted average of 18.4%. Similarly, the statistical analysis conducted on geographies consisting of 274,896,002 people shows a poor positive correlation between the proportion of Nigerians and poverty level among single fathers in the United States with a correlation coefficient (R) of 0.132 and weighted average of 16.1%, a difference of 14.5%.
Single Father Poverty Correlation Summary
| Measurement | Immigrants from Dominican Republic | Nigerian |
| Minimum | 1.2% | 3.1% |
| Maximum | 49.7% | 39.7% |
| Range | 48.4% | 36.6% |
| Mean | 20.0% | 17.3% |
| Median | 18.2% | 16.2% |
| Interquartile 25% (IQ1) | 15.4% | 13.9% |
| Interquartile 75% (IQ3) | 23.2% | 19.6% |
| Interquartile Range (IQR) | 7.8% | 5.7% |
| Standard Deviation (Sample) | 9.0% | 8.0% |
| Standard Deviation (Population) | 9.0% | 7.9% |
Similar Demographics by Single Father Poverty
Demographics Similar to Immigrants from Dominican Republic by Single Father Poverty
In terms of single father poverty, the demographic groups most similar to Immigrants from Dominican Republic are Hungarian (18.5%, a difference of 0.22%), White/Caucasian (18.4%, a difference of 0.32%), Comanche (18.5%, a difference of 0.32%), Celtic (18.5%, a difference of 0.37%), and Ute (18.5%, a difference of 0.51%).
| Demographics | Rating | Rank | Single Father Poverty |
| Alaska Natives | 0.0 /100 | #293 | Tragic 18.1% |
| U.S. Virgin Islanders | 0.0 /100 | #294 | Tragic 18.1% |
| Yakama | 0.0 /100 | #295 | Tragic 18.1% |
| Seminole | 0.0 /100 | #296 | Tragic 18.1% |
| French | 0.0 /100 | #297 | Tragic 18.2% |
| Africans | 0.0 /100 | #298 | Tragic 18.3% |
| Whites/Caucasians | 0.0 /100 | #299 | Tragic 18.4% |
| Immigrants | Dominican Republic | 0.0 /100 | #300 | Tragic 18.4% |
| Hungarians | 0.0 /100 | #301 | Tragic 18.5% |
| Comanche | 0.0 /100 | #302 | Tragic 18.5% |
| Celtics | 0.0 /100 | #303 | Tragic 18.5% |
| Ute | 0.0 /100 | #304 | Tragic 18.5% |
| Blackfeet | 0.0 /100 | #305 | Tragic 18.5% |
| Scotch-Irish | 0.0 /100 | #306 | Tragic 18.6% |
| French Canadians | 0.0 /100 | #307 | Tragic 18.6% |
Demographics Similar to Nigerians by Single Father Poverty
In terms of single father poverty, the demographic groups most similar to Nigerians are Colombian (16.1%, a difference of 0.020%), Immigrants from Hungary (16.1%, a difference of 0.10%), South African (16.1%, a difference of 0.10%), Jordanian (16.1%, a difference of 0.16%), and Immigrants from France (16.1%, a difference of 0.22%).
| Demographics | Rating | Rank | Single Father Poverty |
| Liberians | 83.3 /100 | #141 | Excellent 16.0% |
| Immigrants | Mexico | 83.3 /100 | #142 | Excellent 16.0% |
| Immigrants | Central America | 83.1 /100 | #143 | Excellent 16.0% |
| Immigrants | Kuwait | 81.4 /100 | #144 | Excellent 16.0% |
| Immigrants | Western Asia | 80.7 /100 | #145 | Excellent 16.0% |
| Immigrants | Hungary | 78.3 /100 | #146 | Good 16.1% |
| Colombians | 77.1 /100 | #147 | Good 16.1% |
| Nigerians | 76.8 /100 | #148 | Good 16.1% |
| South Africans | 75.1 /100 | #149 | Good 16.1% |
| Jordanians | 74.2 /100 | #150 | Good 16.1% |
| Immigrants | France | 73.1 /100 | #151 | Good 16.1% |
| Immigrants | Zimbabwe | 72.1 /100 | #152 | Good 16.1% |
| Immigrants | Israel | 72.0 /100 | #153 | Good 16.1% |
| Mexicans | 70.1 /100 | #154 | Good 16.1% |
| Immigrants | Nicaragua | 67.8 /100 | #155 | Good 16.2% |