Immigrants from Dominican Republic vs Bermudan In Labor Force | Age > 16
COMPARE
Immigrants from Dominican Republic
Bermudan
In Labor Force | Age > 16
In Labor Force | Age > 16 Comparison
Immigrants from Dominican Republic
Bermudans
64.4%
IN LABOR FORCE | AGE > 16
1.5/ 100
METRIC RATING
252nd/ 347
METRIC RANK
66.0%
IN LABOR FORCE | AGE > 16
99.3/ 100
METRIC RATING
88th/ 347
METRIC RANK
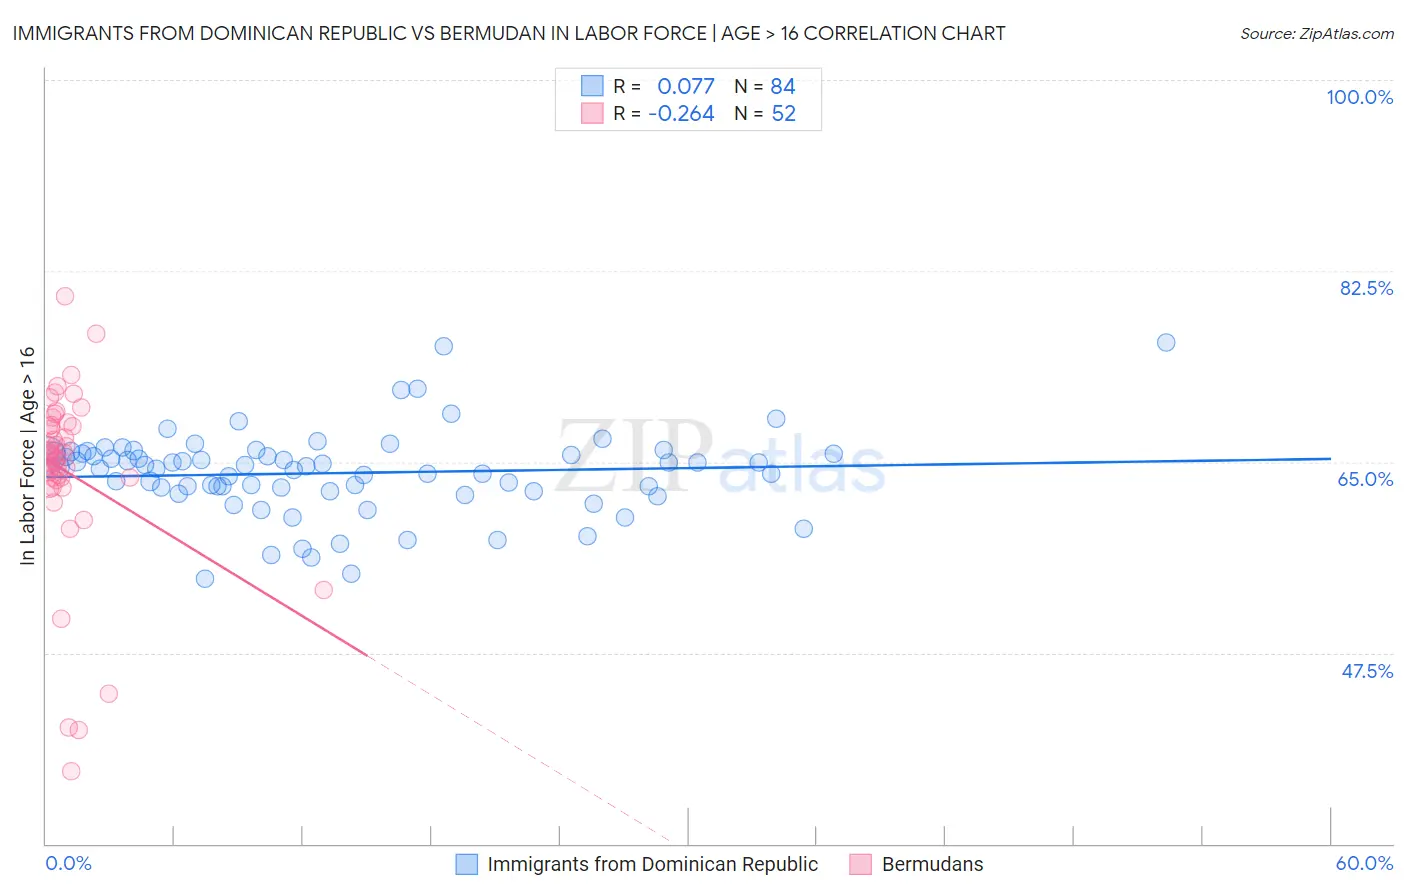
Immigrants from Dominican Republic vs Bermudan In Labor Force | Age > 16 Correlation Chart
The statistical analysis conducted on geographies consisting of 275,136,477 people shows a slight positive correlation between the proportion of Immigrants from Dominican Republic and labor force participation rate among population ages 16 and over in the United States with a correlation coefficient (R) of 0.077 and weighted average of 64.4%. Similarly, the statistical analysis conducted on geographies consisting of 55,730,379 people shows a weak negative correlation between the proportion of Bermudans and labor force participation rate among population ages 16 and over in the United States with a correlation coefficient (R) of -0.264 and weighted average of 66.0%, a difference of 2.6%.
In Labor Force | Age > 16 Correlation Summary
| Measurement | Immigrants from Dominican Republic | Bermudan |
| Minimum | 54.3% | 36.6% |
| Maximum | 75.9% | 80.2% |
| Range | 21.6% | 43.6% |
| Mean | 64.0% | 64.1% |
| Median | 64.6% | 65.6% |
| Interquartile 25% (IQ1) | 62.5% | 63.4% |
| Interquartile 75% (IQ3) | 65.7% | 68.3% |
| Interquartile Range (IQR) | 3.3% | 4.9% |
| Standard Deviation (Sample) | 3.8% | 8.4% |
| Standard Deviation (Population) | 3.8% | 8.3% |
Similar Demographics by In Labor Force | Age > 16
Demographics Similar to Immigrants from Dominican Republic by In Labor Force | Age > 16
In terms of in labor force | age > 16, the demographic groups most similar to Immigrants from Dominican Republic are Czechoslovakian (64.3%, a difference of 0.010%), Immigrants from Uzbekistan (64.3%, a difference of 0.010%), Portuguese (64.4%, a difference of 0.030%), British West Indian (64.4%, a difference of 0.050%), and German (64.4%, a difference of 0.060%).
| Demographics | Rating | Rank | In Labor Force | Age > 16 |
| West Indians | 3.0 /100 | #245 | Tragic 64.5% |
| Immigrants | Caribbean | 2.3 /100 | #246 | Tragic 64.4% |
| Swiss | 2.1 /100 | #247 | Tragic 64.4% |
| Immigrants | Barbados | 2.1 /100 | #248 | Tragic 64.4% |
| Germans | 1.8 /100 | #249 | Tragic 64.4% |
| British West Indians | 1.8 /100 | #250 | Tragic 64.4% |
| Portuguese | 1.6 /100 | #251 | Tragic 64.4% |
| Immigrants | Dominican Republic | 1.5 /100 | #252 | Tragic 64.4% |
| Czechoslovakians | 1.4 /100 | #253 | Tragic 64.3% |
| Immigrants | Uzbekistan | 1.4 /100 | #254 | Tragic 64.3% |
| Hispanics or Latinos | 1.1 /100 | #255 | Tragic 64.3% |
| Immigrants | Mexico | 1.0 /100 | #256 | Tragic 64.3% |
| Inupiat | 0.8 /100 | #257 | Tragic 64.3% |
| Immigrants | Scotland | 0.8 /100 | #258 | Tragic 64.2% |
| Immigrants | Western Europe | 0.7 /100 | #259 | Tragic 64.2% |
Demographics Similar to Bermudans by In Labor Force | Age > 16
In terms of in labor force | age > 16, the demographic groups most similar to Bermudans are South American Indian (66.0%, a difference of 0.0%), South American (66.0%, a difference of 0.010%), Mongolian (66.1%, a difference of 0.030%), Immigrants from Jordan (66.1%, a difference of 0.040%), and Central American (66.1%, a difference of 0.040%).
| Demographics | Rating | Rank | In Labor Force | Age > 16 |
| Moroccans | 99.5 /100 | #81 | Exceptional 66.1% |
| German Russians | 99.4 /100 | #82 | Exceptional 66.1% |
| Immigrants | Jordan | 99.4 /100 | #83 | Exceptional 66.1% |
| Central Americans | 99.4 /100 | #84 | Exceptional 66.1% |
| Mongolians | 99.4 /100 | #85 | Exceptional 66.1% |
| South Americans | 99.4 /100 | #86 | Exceptional 66.0% |
| South American Indians | 99.4 /100 | #87 | Exceptional 66.0% |
| Bermudans | 99.3 /100 | #88 | Exceptional 66.0% |
| Immigrants | Laos | 99.2 /100 | #89 | Exceptional 66.0% |
| Chileans | 99.2 /100 | #90 | Exceptional 66.0% |
| Iranians | 99.2 /100 | #91 | Exceptional 66.0% |
| Aleuts | 99.1 /100 | #92 | Exceptional 66.0% |
| Immigrants | South America | 99.1 /100 | #93 | Exceptional 66.0% |
| Immigrants | Cambodia | 99.1 /100 | #94 | Exceptional 66.0% |
| Immigrants | Uruguay | 99.1 /100 | #95 | Exceptional 66.0% |