Immigrants from Dominican Republic vs Bolivian Single Male Poverty
COMPARE
Immigrants from Dominican Republic
Bolivian
Single Male Poverty
Single Male Poverty Comparison
Immigrants from Dominican Republic
Bolivians
14.8%
SINGLE MALE POVERTY
0.0/ 100
METRIC RATING
297th/ 347
METRIC RANK
11.2%
SINGLE MALE POVERTY
100.0/ 100
METRIC RATING
23rd/ 347
METRIC RANK
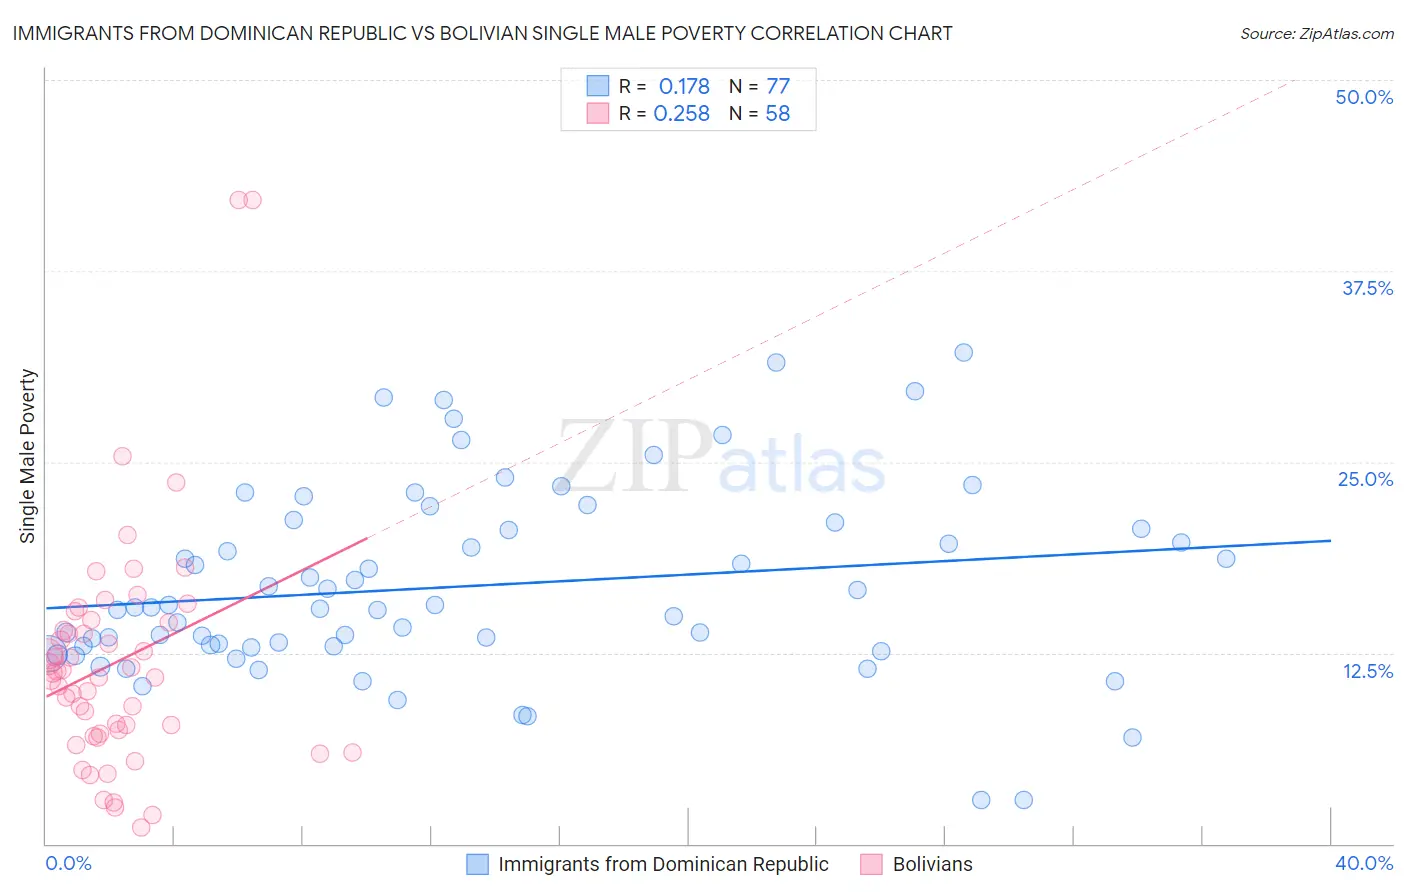
Immigrants from Dominican Republic vs Bolivian Single Male Poverty Correlation Chart
The statistical analysis conducted on geographies consisting of 249,403,835 people shows a poor positive correlation between the proportion of Immigrants from Dominican Republic and poverty level among single males in the United States with a correlation coefficient (R) of 0.178 and weighted average of 14.8%. Similarly, the statistical analysis conducted on geographies consisting of 171,550,226 people shows a weak positive correlation between the proportion of Bolivians and poverty level among single males in the United States with a correlation coefficient (R) of 0.258 and weighted average of 11.2%, a difference of 31.5%.
Single Male Poverty Correlation Summary
| Measurement | Immigrants from Dominican Republic | Bolivian |
| Minimum | 2.9% | 1.1% |
| Maximum | 32.2% | 42.1% |
| Range | 29.3% | 41.0% |
| Mean | 16.8% | 11.9% |
| Median | 15.4% | 11.1% |
| Interquartile 25% (IQ1) | 12.9% | 7.2% |
| Interquartile 75% (IQ3) | 20.8% | 14.5% |
| Interquartile Range (IQR) | 7.9% | 7.3% |
| Standard Deviation (Sample) | 6.2% | 7.7% |
| Standard Deviation (Population) | 6.2% | 7.6% |
Similar Demographics by Single Male Poverty
Demographics Similar to Immigrants from Dominican Republic by Single Male Poverty
In terms of single male poverty, the demographic groups most similar to Immigrants from Dominican Republic are African (14.7%, a difference of 0.35%), Scotch-Irish (14.7%, a difference of 0.67%), Ottawa (14.6%, a difference of 1.1%), French American Indian (15.0%, a difference of 1.3%), and French Canadian (14.6%, a difference of 1.3%).
| Demographics | Rating | Rank | Single Male Poverty |
| U.S. Virgin Islanders | 0.0 /100 | #290 | Tragic 14.5% |
| Bahamians | 0.0 /100 | #291 | Tragic 14.6% |
| Immigrants | Nonimmigrants | 0.0 /100 | #292 | Tragic 14.6% |
| French Canadians | 0.0 /100 | #293 | Tragic 14.6% |
| Ottawa | 0.0 /100 | #294 | Tragic 14.6% |
| Scotch-Irish | 0.0 /100 | #295 | Tragic 14.7% |
| Africans | 0.0 /100 | #296 | Tragic 14.7% |
| Immigrants | Dominican Republic | 0.0 /100 | #297 | Tragic 14.8% |
| French American Indians | 0.0 /100 | #298 | Tragic 15.0% |
| Delaware | 0.0 /100 | #299 | Tragic 15.0% |
| Cree | 0.0 /100 | #300 | Tragic 15.1% |
| Dominicans | 0.0 /100 | #301 | Tragic 15.2% |
| Alsatians | 0.0 /100 | #302 | Tragic 15.2% |
| Aleuts | 0.0 /100 | #303 | Tragic 15.4% |
| Alaska Natives | 0.0 /100 | #304 | Tragic 15.4% |
Demographics Similar to Bolivians by Single Male Poverty
In terms of single male poverty, the demographic groups most similar to Bolivians are Indian (Asian) (11.3%, a difference of 0.20%), Immigrants from Pakistan (11.2%, a difference of 0.21%), Maltese (11.3%, a difference of 0.22%), Asian (11.2%, a difference of 0.30%), and Immigrants from Japan (11.3%, a difference of 0.55%).
| Demographics | Rating | Rank | Single Male Poverty |
| Bhutanese | 100.0 /100 | #16 | Exceptional 11.1% |
| Tsimshian | 100.0 /100 | #17 | Exceptional 11.1% |
| Immigrants | Bolivia | 100.0 /100 | #18 | Exceptional 11.1% |
| Immigrants | Moldova | 100.0 /100 | #19 | Exceptional 11.2% |
| Ethiopians | 100.0 /100 | #20 | Exceptional 11.2% |
| Asians | 100.0 /100 | #21 | Exceptional 11.2% |
| Immigrants | Pakistan | 100.0 /100 | #22 | Exceptional 11.2% |
| Bolivians | 100.0 /100 | #23 | Exceptional 11.2% |
| Indians (Asian) | 100.0 /100 | #24 | Exceptional 11.3% |
| Maltese | 100.0 /100 | #25 | Exceptional 11.3% |
| Immigrants | Japan | 100.0 /100 | #26 | Exceptional 11.3% |
| Immigrants | China | 100.0 /100 | #27 | Exceptional 11.4% |
| Immigrants | Asia | 100.0 /100 | #28 | Exceptional 11.4% |
| Immigrants | Egypt | 100.0 /100 | #29 | Exceptional 11.4% |
| Iranians | 100.0 /100 | #30 | Exceptional 11.4% |