Immigrants from Dominican Republic vs Alaskan Athabascan Single Male Poverty
COMPARE
Immigrants from Dominican Republic
Alaskan Athabascan
Single Male Poverty
Single Male Poverty Comparison
Immigrants from Dominican Republic
Alaskan Athabascans
14.8%
SINGLE MALE POVERTY
0.0/ 100
METRIC RATING
297th/ 347
METRIC RANK
16.1%
SINGLE MALE POVERTY
0.0/ 100
METRIC RATING
314th/ 347
METRIC RANK
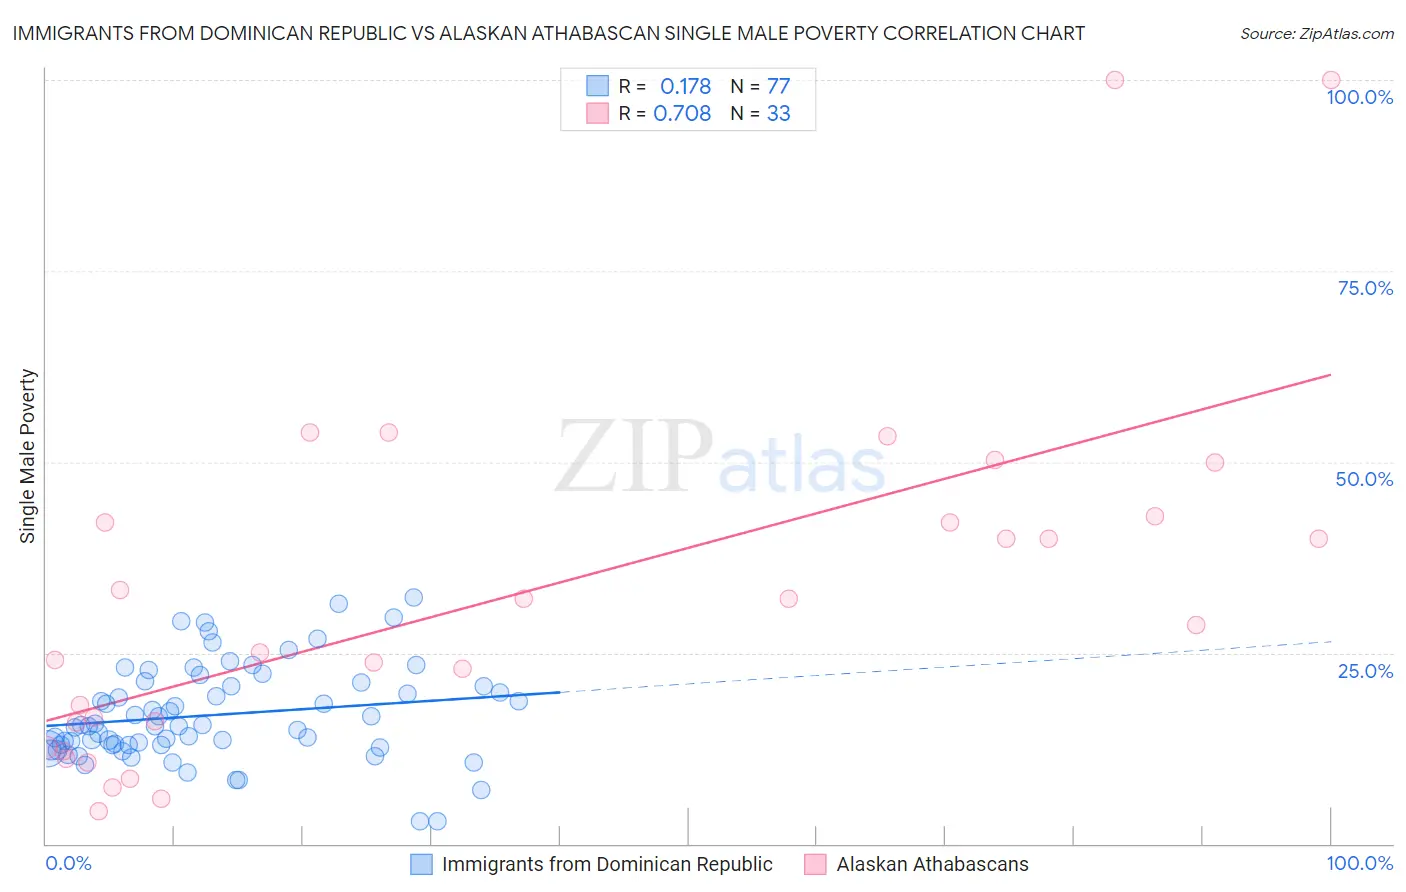
Immigrants from Dominican Republic vs Alaskan Athabascan Single Male Poverty Correlation Chart
The statistical analysis conducted on geographies consisting of 249,403,835 people shows a poor positive correlation between the proportion of Immigrants from Dominican Republic and poverty level among single males in the United States with a correlation coefficient (R) of 0.178 and weighted average of 14.8%. Similarly, the statistical analysis conducted on geographies consisting of 44,419,805 people shows a strong positive correlation between the proportion of Alaskan Athabascans and poverty level among single males in the United States with a correlation coefficient (R) of 0.708 and weighted average of 16.1%, a difference of 9.0%.
Single Male Poverty Correlation Summary
| Measurement | Immigrants from Dominican Republic | Alaskan Athabascan |
| Minimum | 2.9% | 4.3% |
| Maximum | 32.2% | 100.0% |
| Range | 29.3% | 95.7% |
| Mean | 16.8% | 32.4% |
| Median | 15.4% | 28.6% |
| Interquartile 25% (IQ1) | 12.9% | 14.2% |
| Interquartile 75% (IQ3) | 20.8% | 42.5% |
| Interquartile Range (IQR) | 7.9% | 28.2% |
| Standard Deviation (Sample) | 6.2% | 23.3% |
| Standard Deviation (Population) | 6.2% | 22.9% |
Demographics Similar to Immigrants from Dominican Republic and Alaskan Athabascans by Single Male Poverty
In terms of single male poverty, the demographic groups most similar to Immigrants from Dominican Republic are African (14.7%, a difference of 0.35%), Scotch-Irish (14.7%, a difference of 0.67%), French American Indian (15.0%, a difference of 1.3%), Delaware (15.0%, a difference of 1.7%), and Cree (15.1%, a difference of 2.1%). Similarly, the demographic groups most similar to Alaskan Athabascans are Cheyenne (16.1%, a difference of 0.040%), Cherokee (16.1%, a difference of 0.29%), Seminole (16.0%, a difference of 0.52%), Comanche (16.0%, a difference of 0.52%), and Yakama (15.9%, a difference of 1.1%).
| Demographics | Rating | Rank | Single Male Poverty |
| Scotch-Irish | 0.0 /100 | #295 | Tragic 14.7% |
| Africans | 0.0 /100 | #296 | Tragic 14.7% |
| Immigrants | Dominican Republic | 0.0 /100 | #297 | Tragic 14.8% |
| French American Indians | 0.0 /100 | #298 | Tragic 15.0% |
| Delaware | 0.0 /100 | #299 | Tragic 15.0% |
| Cree | 0.0 /100 | #300 | Tragic 15.1% |
| Dominicans | 0.0 /100 | #301 | Tragic 15.2% |
| Alsatians | 0.0 /100 | #302 | Tragic 15.2% |
| Aleuts | 0.0 /100 | #303 | Tragic 15.4% |
| Alaska Natives | 0.0 /100 | #304 | Tragic 15.4% |
| Blackfeet | 0.0 /100 | #305 | Tragic 15.5% |
| Pennsylvania Germans | 0.0 /100 | #306 | Tragic 15.6% |
| Ute | 0.0 /100 | #307 | Tragic 15.7% |
| Potawatomi | 0.0 /100 | #308 | Tragic 15.8% |
| Americans | 0.0 /100 | #309 | Tragic 15.8% |
| Yakama | 0.0 /100 | #310 | Tragic 15.9% |
| Seminole | 0.0 /100 | #311 | Tragic 16.0% |
| Comanche | 0.0 /100 | #312 | Tragic 16.0% |
| Cherokee | 0.0 /100 | #313 | Tragic 16.1% |
| Alaskan Athabascans | 0.0 /100 | #314 | Tragic 16.1% |
| Cheyenne | 0.0 /100 | #315 | Tragic 16.1% |