Immigrants from Dominican Republic vs Slovak Single Male Poverty
COMPARE
Immigrants from Dominican Republic
Slovak
Single Male Poverty
Single Male Poverty Comparison
Immigrants from Dominican Republic
Slovaks
14.8%
SINGLE MALE POVERTY
0.0/ 100
METRIC RATING
297th/ 347
METRIC RANK
14.1%
SINGLE MALE POVERTY
0.0/ 100
METRIC RATING
278th/ 347
METRIC RANK
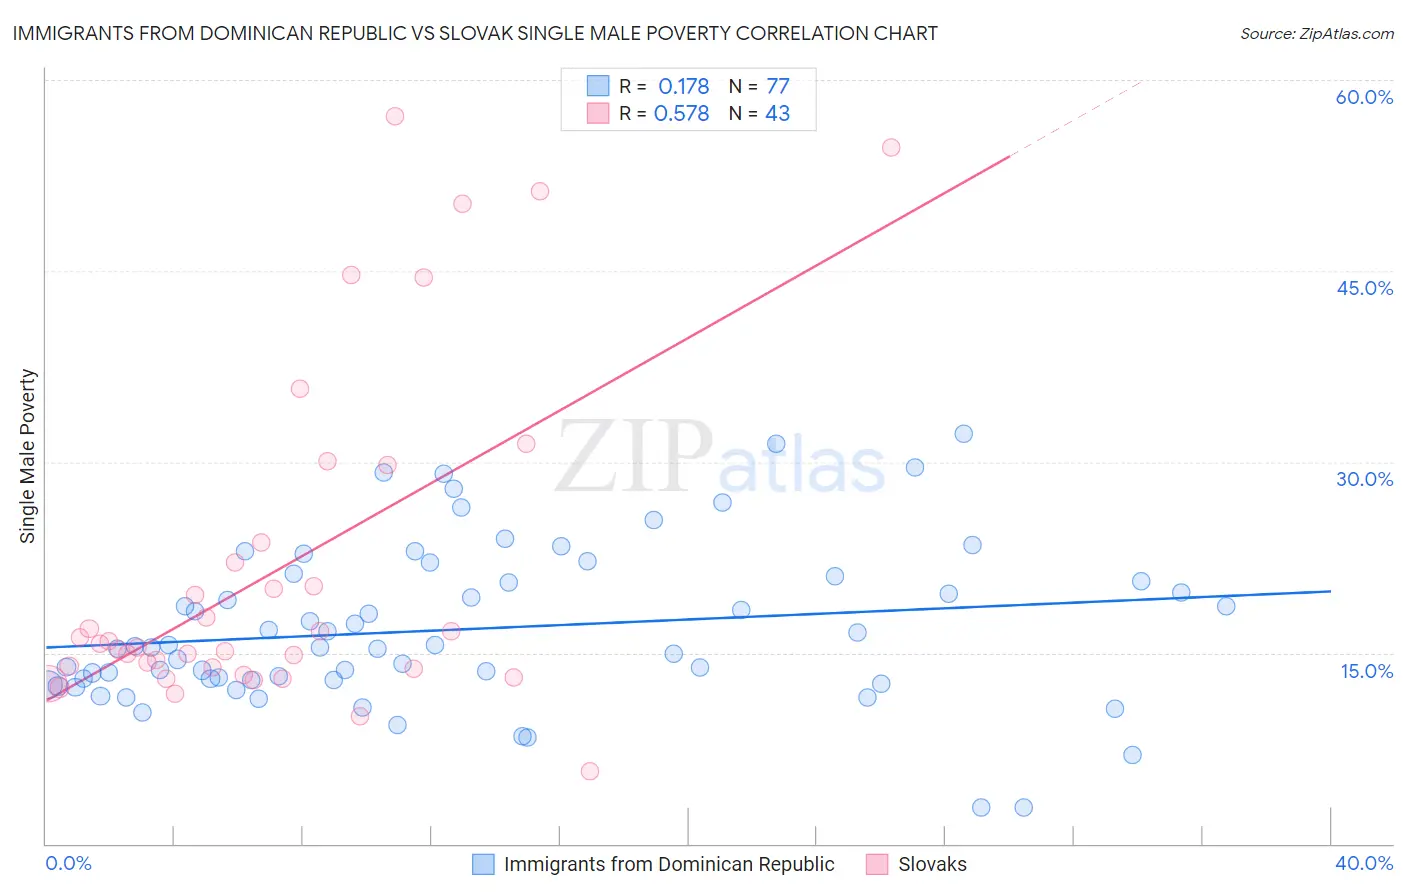
Immigrants from Dominican Republic vs Slovak Single Male Poverty Correlation Chart
The statistical analysis conducted on geographies consisting of 249,403,835 people shows a poor positive correlation between the proportion of Immigrants from Dominican Republic and poverty level among single males in the United States with a correlation coefficient (R) of 0.178 and weighted average of 14.8%. Similarly, the statistical analysis conducted on geographies consisting of 343,124,767 people shows a substantial positive correlation between the proportion of Slovaks and poverty level among single males in the United States with a correlation coefficient (R) of 0.578 and weighted average of 14.1%, a difference of 4.9%.
Single Male Poverty Correlation Summary
| Measurement | Immigrants from Dominican Republic | Slovak |
| Minimum | 2.9% | 5.7% |
| Maximum | 32.2% | 57.1% |
| Range | 29.3% | 51.4% |
| Mean | 16.8% | 21.6% |
| Median | 15.4% | 15.7% |
| Interquartile 25% (IQ1) | 12.9% | 13.8% |
| Interquartile 75% (IQ3) | 20.8% | 23.6% |
| Interquartile Range (IQR) | 7.9% | 9.9% |
| Standard Deviation (Sample) | 6.2% | 13.2% |
| Standard Deviation (Population) | 6.2% | 13.0% |
Demographics Similar to Immigrants from Dominican Republic and Slovaks by Single Male Poverty
In terms of single male poverty, the demographic groups most similar to Immigrants from Dominican Republic are African (14.7%, a difference of 0.35%), Scotch-Irish (14.7%, a difference of 0.67%), Ottawa (14.6%, a difference of 1.1%), French Canadian (14.6%, a difference of 1.3%), and Nonimmigrants (14.6%, a difference of 1.4%). Similarly, the demographic groups most similar to Slovaks are Indonesian (14.1%, a difference of 0.040%), Immigrants from Honduras (14.1%, a difference of 0.060%), Hmong (14.2%, a difference of 0.74%), Hispanic or Latino (14.2%, a difference of 0.77%), and Spanish American (14.2%, a difference of 0.93%).
| Demographics | Rating | Rank | Single Male Poverty |
| Immigrants | Honduras | 0.0 /100 | #277 | Tragic 14.1% |
| Slovaks | 0.0 /100 | #278 | Tragic 14.1% |
| Indonesians | 0.0 /100 | #279 | Tragic 14.1% |
| Hmong | 0.0 /100 | #280 | Tragic 14.2% |
| Hispanics or Latinos | 0.0 /100 | #281 | Tragic 14.2% |
| Spanish Americans | 0.0 /100 | #282 | Tragic 14.2% |
| Yaqui | 0.0 /100 | #283 | Tragic 14.2% |
| Immigrants | Bahamas | 0.0 /100 | #284 | Tragic 14.4% |
| French | 0.0 /100 | #285 | Tragic 14.4% |
| Celtics | 0.0 /100 | #286 | Tragic 14.5% |
| Iroquois | 0.0 /100 | #287 | Tragic 14.5% |
| Whites/Caucasians | 0.0 /100 | #288 | Tragic 14.5% |
| Immigrants | Dominica | 0.0 /100 | #289 | Tragic 14.5% |
| U.S. Virgin Islanders | 0.0 /100 | #290 | Tragic 14.5% |
| Bahamians | 0.0 /100 | #291 | Tragic 14.6% |
| Immigrants | Nonimmigrants | 0.0 /100 | #292 | Tragic 14.6% |
| French Canadians | 0.0 /100 | #293 | Tragic 14.6% |
| Ottawa | 0.0 /100 | #294 | Tragic 14.6% |
| Scotch-Irish | 0.0 /100 | #295 | Tragic 14.7% |
| Africans | 0.0 /100 | #296 | Tragic 14.7% |
| Immigrants | Dominican Republic | 0.0 /100 | #297 | Tragic 14.8% |