Immigrants from Denmark vs Jordanian Family Poverty
COMPARE
Immigrants from Denmark
Jordanian
Family Poverty
Family Poverty Comparison
Immigrants from Denmark
Jordanians
8.0%
FAMILY POVERTY
97.1/ 100
METRIC RATING
89th/ 347
METRIC RANK
8.2%
FAMILY POVERTY
94.8/ 100
METRIC RATING
109th/ 347
METRIC RANK
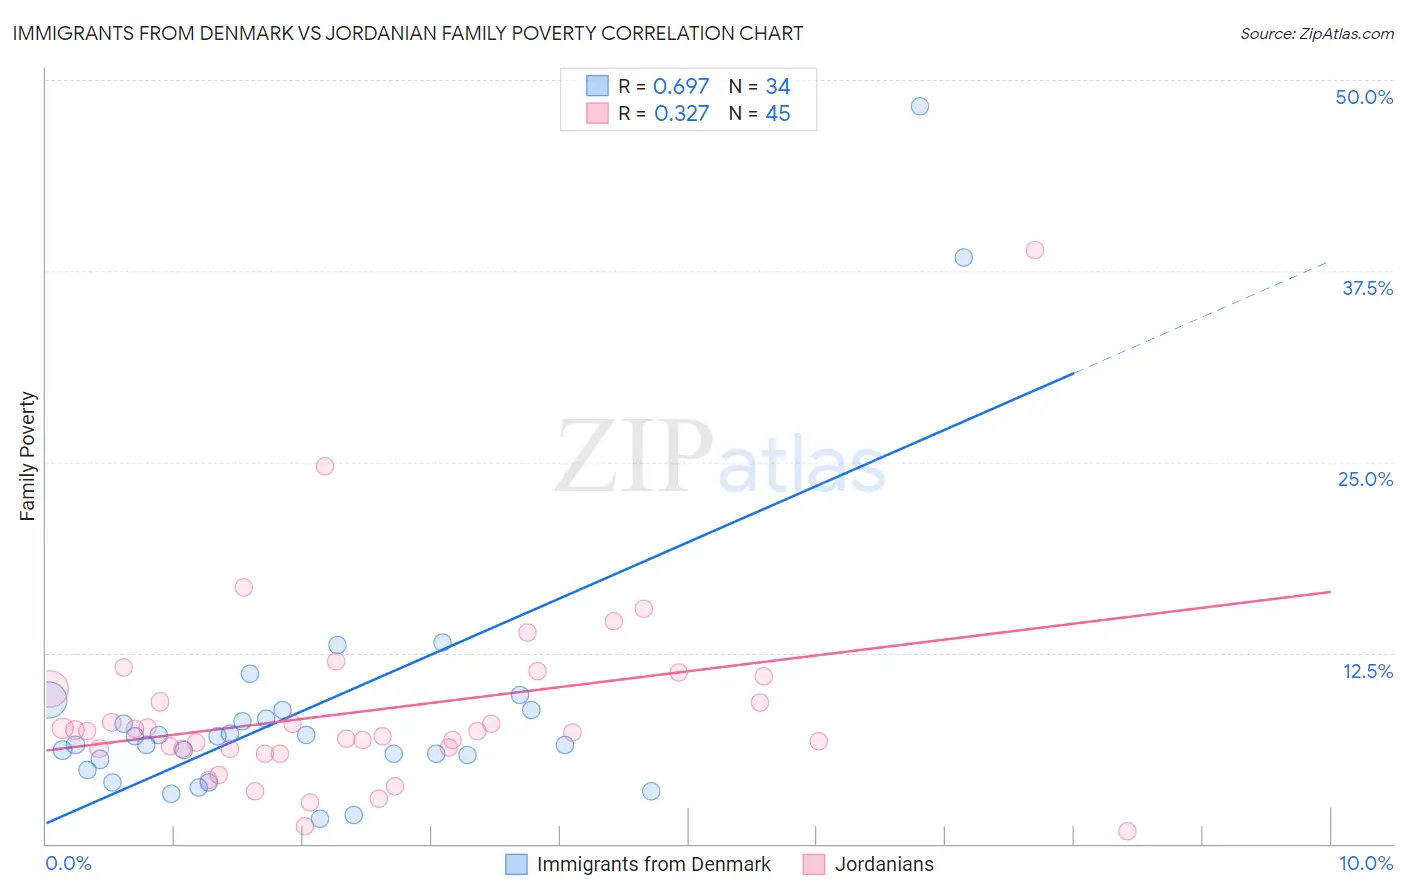
Immigrants from Denmark vs Jordanian Family Poverty Correlation Chart
The statistical analysis conducted on geographies consisting of 136,272,290 people shows a significant positive correlation between the proportion of Immigrants from Denmark and poverty level among families in the United States with a correlation coefficient (R) of 0.697 and weighted average of 8.0%. Similarly, the statistical analysis conducted on geographies consisting of 166,331,422 people shows a mild positive correlation between the proportion of Jordanians and poverty level among families in the United States with a correlation coefficient (R) of 0.327 and weighted average of 8.2%, a difference of 2.3%.
Family Poverty Correlation Summary
| Measurement | Immigrants from Denmark | Jordanian |
| Minimum | 1.6% | 0.81% |
| Maximum | 48.3% | 38.9% |
| Range | 46.7% | 38.1% |
| Mean | 8.9% | 8.7% |
| Median | 6.7% | 7.4% |
| Interquartile 25% (IQ1) | 5.5% | 6.2% |
| Interquartile 75% (IQ3) | 8.7% | 10.6% |
| Interquartile Range (IQR) | 3.2% | 4.3% |
| Standard Deviation (Sample) | 9.2% | 6.3% |
| Standard Deviation (Population) | 9.1% | 6.2% |
Demographics Similar to Immigrants from Denmark and Jordanians by Family Poverty
In terms of family poverty, the demographic groups most similar to Immigrants from Denmark are Immigrants from England (8.0%, a difference of 0.0%), Immigrants from Italy (8.0%, a difference of 0.16%), Czechoslovakian (8.0%, a difference of 0.40%), Tlingit-Haida (8.0%, a difference of 0.58%), and Immigrants from Pakistan (8.0%, a difference of 0.69%). Similarly, the demographic groups most similar to Jordanians are Basque (8.1%, a difference of 0.090%), French Canadian (8.1%, a difference of 0.18%), Egyptian (8.1%, a difference of 0.22%), Laotian (8.1%, a difference of 0.63%), and Slavic (8.1%, a difference of 0.66%).
| Demographics | Rating | Rank | Family Poverty |
| Immigrants | Denmark | 97.1 /100 | #89 | Exceptional 8.0% |
| Immigrants | England | 97.1 /100 | #90 | Exceptional 8.0% |
| Immigrants | Italy | 97.0 /100 | #91 | Exceptional 8.0% |
| Czechoslovakians | 96.8 /100 | #92 | Exceptional 8.0% |
| Tlingit-Haida | 96.7 /100 | #93 | Exceptional 8.0% |
| Immigrants | Pakistan | 96.6 /100 | #94 | Exceptional 8.0% |
| Immigrants | Philippines | 96.5 /100 | #95 | Exceptional 8.0% |
| Immigrants | Turkey | 96.5 /100 | #96 | Exceptional 8.0% |
| Immigrants | Switzerland | 96.1 /100 | #97 | Exceptional 8.1% |
| Immigrants | South Africa | 95.9 /100 | #98 | Exceptional 8.1% |
| Welsh | 95.8 /100 | #99 | Exceptional 8.1% |
| New Zealanders | 95.8 /100 | #100 | Exceptional 8.1% |
| Immigrants | Norway | 95.7 /100 | #101 | Exceptional 8.1% |
| Immigrants | Indonesia | 95.7 /100 | #102 | Exceptional 8.1% |
| Immigrants | Eastern Europe | 95.6 /100 | #103 | Exceptional 8.1% |
| Slavs | 95.6 /100 | #104 | Exceptional 8.1% |
| Laotians | 95.6 /100 | #105 | Exceptional 8.1% |
| Egyptians | 95.1 /100 | #106 | Exceptional 8.1% |
| French Canadians | 95.0 /100 | #107 | Exceptional 8.1% |
| Basques | 94.9 /100 | #108 | Exceptional 8.1% |
| Jordanians | 94.8 /100 | #109 | Exceptional 8.2% |