Immigrants from Denmark vs Jordanian Nursery School

COMPARE

Immigrants from Denmark
Race
Ancestry
AfghanAfricanAlaska NativeAlaskan AthabascanAlbanianAleutAlsatianAmericanApacheArabArapahoArgentineanArmenianAssyrian/Chaldean/SyriacAustralianAustrianBahamianBangladeshiBarbadianBasqueBelgianBelizeanBermudanBhutaneseBlackfeetBolivianBrazilianBritishBritish West IndianBulgarianBurmeseCajunCambodianCanadianCape VerdeanCarpatho RusynCelticCentral AmericanCentral American IndianCherokeeCheyenneChickasawChileanChineseChippewaChoctawColombianColvilleComancheCosta RicanCreeCreekCroatianCrowCubanCypriotCzechCzechoslovakianDanishDelawareDominicanDutchDutch West IndianEastern EuropeanEcuadorianEgyptianEnglishEstonianEthiopianEuropeanFijianFilipinoFinnishFrenchFrench American IndianFrench CanadianGermanGerman RussianGhanaianGreekGuamanian/ChamorroGuatemalanGuyaneseHaitianHmongHonduranHopiHoumaHungarianIcelanderIndian (Asian)IndonesianInupiatIranianIraqiIrishIroquoisIsraeliItalianJamaicanJapaneseKenyanKiowaKoreanLaotianLatvianLebaneseLiberianLithuanianLumbeeLuxembourgerMacedonianMalaysianMalteseMarshalleseMenomineeMexicanMexican American IndianMongolianMoroccanNative HawaiianNavajoNepaleseNew ZealanderNicaraguanNigerianNorthern EuropeanNorwegianOkinawanOsageOttawaPaiutePakistaniPalestinianPanamanianParaguayanPennsylvania GermanPeruvianPimaPolishPortuguesePotawatomiPuebloPuerto RicanPuget Sound SalishRomanianRussianSalvadoranSamoanScandinavianScotch-IrishScottishSeminoleSenegaleseSerbianShoshoneSierra LeoneanSiouxSlavicSlovakSloveneSomaliSouth AfricanSouth AmericanSouth American IndianSoviet UnionSpaniardSpanishSpanish AmericanSpanish American IndianSri LankanSubsaharan AfricanSudaneseSwedishSwissSyrianTaiwaneseThaiTlingit-HaidaTohono O'OdhamTonganTrinidadian and TobagonianTsimshianTurkishU.S. Virgin IslanderUgandanUkrainianUruguayanUteVenezuelanVietnameseWelshWest IndianYakamaYaquiYugoslavianYumanYup'ikZimbabwean
Immigration
NonimmigrantsImmigrantsAfghanistanAfricaAlbaniaArgentinaArmeniaAsiaAustraliaAustriaBahamasBangladeshBarbadosBelarusBelgiumBelizeBoliviaBosnia and HerzegovinaBrazilBulgariaBurma/MyanmarCabo VerdeCambodiaCameroonCanadaCaribbeanCentral AmericaChileChinaColombiaCongoCosta RicaCroatiaCubaCzechoslovakiaDenmarkDominicaDominican RepublicEastern AfricaEastern AsiaEastern EuropeEcuadorEgyptEl SalvadorEnglandEritreaEthiopiaEuropeFijiFranceGermanyGhanaGreeceGrenadaGuatemalaGuyanaHaitiHondurasHong KongHungaryIndiaIndonesiaIranIraqIrelandIsraelItalyJamaicaJapanJordanKazakhstanKenyaKoreaKuwaitLaosLatin AmericaLatviaLebanonLiberiaLithuaniaMalaysiaMexicoMicronesiaMiddle AfricaMoldovaMoroccoNepalNetherlandsNicaraguaNigeriaNorth AmericaNorth MacedoniaNorthern AfricaNorthern EuropeNorwayOceaniaPakistanPanamaPeruPhilippinesPolandPortugalRomaniaRussiaSaudi ArabiaScotlandSenegalSerbiaSierra LeoneSingaporeSomaliaSouth AfricaSouth AmericaSouth Central AsiaSouth Eastern AsiaSouthern EuropeSpainSri LankaSt. Vincent and the GrenadinesSudanSwedenSwitzerlandSyriaTaiwanThailandTrinidad and TobagoTurkeyUgandaUkraineUruguayUzbekistanVenezuelaVietnamWest IndiesWestern AfricaWestern AsiaWestern EuropeYemenZaireZimbabweAzores
Jordanian
Race
Ancestry
AfghanAfricanAlaska NativeAlaskan AthabascanAlbanianAleutAlsatianAmericanApacheArabArapahoArgentineanArmenianAssyrian/Chaldean/SyriacAustralianAustrianBahamianBangladeshiBarbadianBasqueBelgianBelizeanBermudanBhutaneseBlackfeetBolivianBrazilianBritishBritish West IndianBulgarianBurmeseCajunCambodianCanadianCape VerdeanCarpatho RusynCelticCentral AmericanCentral American IndianCherokeeCheyenneChickasawChileanChineseChippewaChoctawColombianColvilleComancheCosta RicanCreeCreekCroatianCrowCubanCypriotCzechCzechoslovakianDanishDelawareDominicanDutchDutch West IndianEastern EuropeanEcuadorianEgyptianEnglishEstonianEthiopianEuropeanFijianFilipinoFinnishFrenchFrench American IndianFrench CanadianGermanGerman RussianGhanaianGreekGuamanian/ChamorroGuatemalanGuyaneseHaitianHmongHonduranHopiHoumaHungarianIcelanderIndian (Asian)IndonesianInupiatIranianIraqiIrishIroquoisIsraeliItalianJamaicanJapaneseJordanianKenyanKiowaKoreanLaotianLatvianLebaneseLiberianLithuanianLumbeeLuxembourgerMacedonianMalaysianMalteseMarshalleseMenomineeMexicanMexican American IndianMongolianMoroccanNative HawaiianNavajoNepaleseNew ZealanderNicaraguanNigerianNorthern EuropeanNorwegianOkinawanOsageOttawaPaiutePakistaniPalestinianPanamanianParaguayanPennsylvania GermanPeruvianPimaPolishPortuguesePotawatomiPuebloPuerto RicanPuget Sound SalishRomanianRussianSalvadoranSamoanScandinavianScotch-IrishScottishSeminoleSenegaleseSerbianShoshoneSierra LeoneanSiouxSlavicSlovakSloveneSomaliSouth AfricanSouth AmericanSouth American IndianSoviet UnionSpaniardSpanishSpanish AmericanSpanish American IndianSri LankanSubsaharan AfricanSudaneseSwedishSwissSyrianTaiwaneseThaiTlingit-HaidaTohono O'OdhamTonganTrinidadian and TobagonianTsimshianTurkishU.S. Virgin IslanderUgandanUkrainianUruguayanUteVenezuelanVietnameseWelshWest IndianYakamaYaquiYugoslavianYumanYup'ikZimbabwean
Immigration
NonimmigrantsImmigrantsAfghanistanAfricaAlbaniaArgentinaArmeniaAsiaAustraliaAustriaBahamasBangladeshBarbadosBelarusBelgiumBelizeBoliviaBosnia and HerzegovinaBrazilBulgariaBurma/MyanmarCabo VerdeCambodiaCameroonCanadaCaribbeanCentral AmericaChileChinaColombiaCongoCosta RicaCroatiaCubaCzechoslovakiaDominicaDominican RepublicEastern AfricaEastern AsiaEastern EuropeEcuadorEgyptEl SalvadorEnglandEritreaEthiopiaEuropeFijiFranceGermanyGhanaGreeceGrenadaGuatemalaGuyanaHaitiHondurasHong KongHungaryIndiaIndonesiaIranIraqIrelandIsraelItalyJamaicaJapanJordanKazakhstanKenyaKoreaKuwaitLaosLatin AmericaLatviaLebanonLiberiaLithuaniaMalaysiaMexicoMicronesiaMiddle AfricaMoldovaMoroccoNepalNetherlandsNicaraguaNigeriaNorth AmericaNorth MacedoniaNorthern AfricaNorthern EuropeNorwayOceaniaPakistanPanamaPeruPhilippinesPolandPortugalRomaniaRussiaSaudi ArabiaScotlandSenegalSerbiaSierra LeoneSingaporeSomaliaSouth AfricaSouth AmericaSouth Central AsiaSouth Eastern AsiaSouthern EuropeSpainSri LankaSt. Vincent and the GrenadinesSudanSwedenSwitzerlandSyriaTaiwanThailandTrinidad and TobagoTurkeyUgandaUkraineUruguayUzbekistanVenezuelaVietnamWest IndiesWestern AfricaWestern AsiaWestern EuropeYemenZaireZimbabweAzores
Nursery School
Income
Poverty
Unemployment
Labor Participation
Family Structure
Vehicle Availability
Education Level
Disability

Nursery School Comparison

Immigrants from Denmark

Jordanians

Exceptional
Good
98.3%
NURSERY SCHOOL
99.1/ 100
METRIC RATING
84th/ 347
METRIC RANK
98.1%
NURSERY SCHOOL
72.9/ 100
METRIC RATING
150th/ 347
METRIC RANK

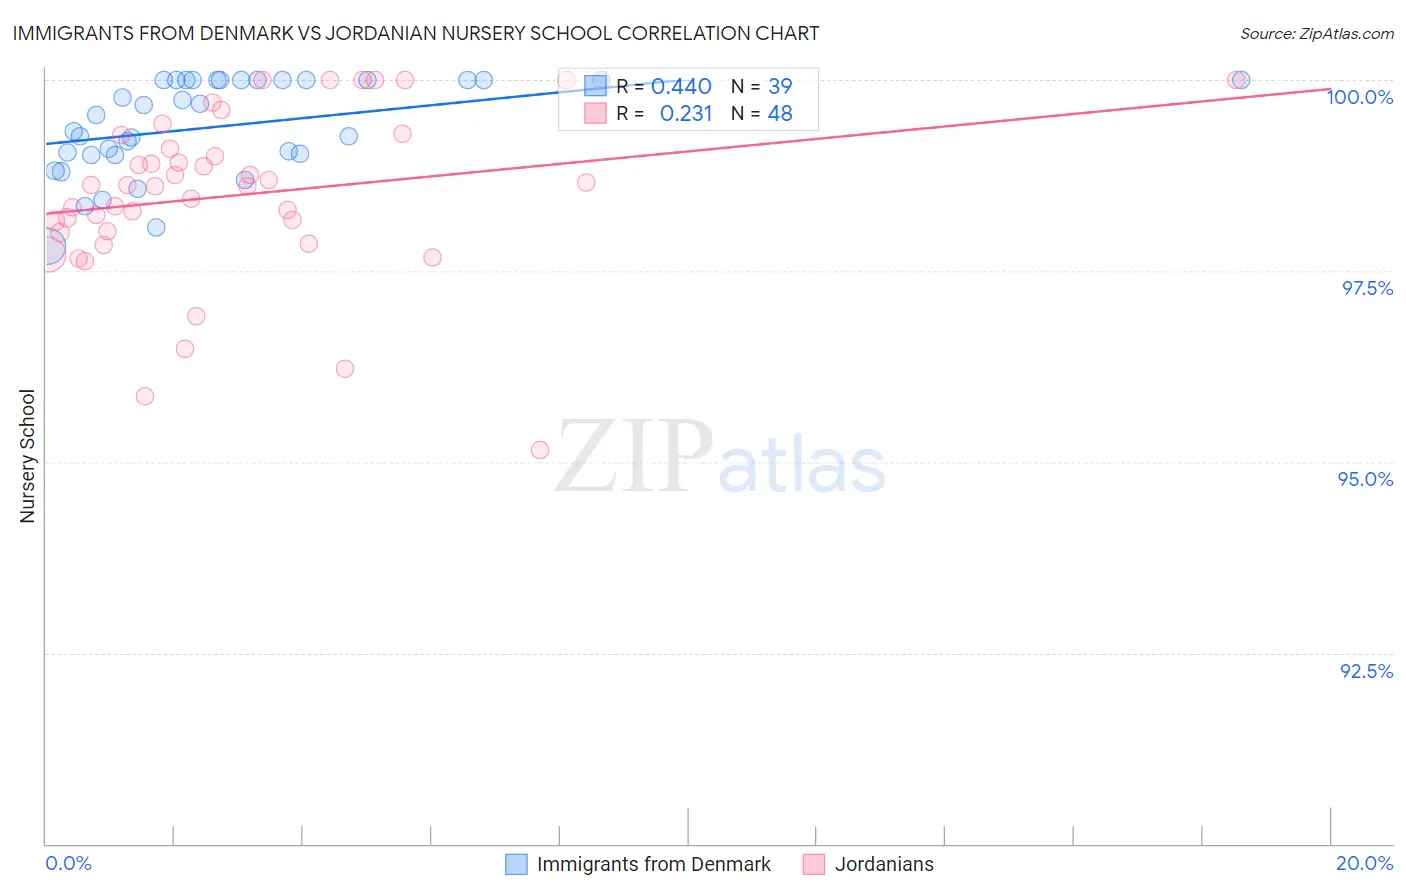
Immigrants from Denmark vs Jordanian Nursery School Correlation Chart

The statistical analysis conducted on geographies consisting of 136,428,049 people shows a moderate positive correlation between the proportion of Immigrants from Denmark and percentage of population with at least nursery school education in the United States with a correlation coefficient (R) of 0.440 and weighted average of 98.3%. Similarly, the statistical analysis conducted on geographies consisting of 166,423,717 people shows a weak positive correlation between the proportion of Jordanians and percentage of population with at least nursery school education in the United States with a correlation coefficient (R) of 0.231 and weighted average of 98.1%, a difference of 0.28%.
Immigrants from Denmark vs Jordanian Nursery School

Nursery School Correlation Summary

MeasurementImmigrants from DenmarkJordanian
Minimum97.8%95.2%
Maximum100.0%100.0%
Range2.2%4.8%
Mean99.4%98.5%
Median99.5%98.6%
Interquartile 25% (IQ1)99.0%98.0%
Interquartile 75% (IQ3)100.0%99.2%
Interquartile Range (IQR)0.98%1.2%
Standard Deviation (Sample)0.63%1.1%
Standard Deviation (Population)0.62%1.1%

Similar Demographics by Nursery School

Demographics Similar to Immigrants from Denmark by Nursery School

In terms of nursery school, the demographic groups most similar to Immigrants from Denmark are Osage (98.3%, a difference of 0.0%), Immigrants from Sweden (98.3%, a difference of 0.0%), Shoshone (98.3%, a difference of 0.010%), Icelander (98.3%, a difference of 0.010%), and Potawatomi (98.3%, a difference of 0.010%).
DemographicsRating | RankNursery School
Immigrants | Lithuania
99.3
/100
|
#77
Exceptional
98.3%
Delaware
99.3
/100
|
#78
Exceptional
98.3%
Immigrants | Belgium
99.3
/100
|
#79
Exceptional
98.3%
Shoshone
99.3
/100
|
#80
Exceptional
98.3%
Icelanders
99.2
/100
|
#81
Exceptional
98.3%
Potawatomi
99.2
/100
|
#82
Exceptional
98.3%
Osage
99.1
/100
|
#83
Exceptional
98.3%
Immigrants | Denmark
99.1
/100
|
#84
Exceptional
98.3%
Immigrants | Sweden
99.1
/100
|
#85
Exceptional
98.3%
Immigrants | Australia
99.0
/100
|
#86
Exceptional
98.3%
Hopi
98.9
/100
|
#87
Exceptional
98.3%
Ukrainians
98.9
/100
|
#88
Exceptional
98.3%
Immigrants | South Africa
98.8
/100
|
#89
Exceptional
98.3%
Immigrants | Western Europe
98.8
/100
|
#90
Exceptional
98.3%
Zimbabweans
98.8
/100
|
#91
Exceptional
98.3%

Demographics Similar to Jordanians by Nursery School

In terms of nursery school, the demographic groups most similar to Jordanians are Apache (98.1%, a difference of 0.0%), Soviet Union (98.0%, a difference of 0.0%), Hmong (98.1%, a difference of 0.010%), Immigrants from Greece (98.1%, a difference of 0.010%), and Dutch West Indian (98.0%, a difference of 0.010%).
DemographicsRating | RankNursery School
Marshallese
81.2
/100
|
#143
Excellent
98.1%
Alsatians
80.3
/100
|
#144
Excellent
98.1%
Immigrants | Israel
78.5
/100
|
#145
Good
98.1%
Filipinos
78.5
/100
|
#146
Good
98.1%
Hmong
75.7
/100
|
#147
Good
98.1%
Immigrants | Greece
75.4
/100
|
#148
Good
98.1%
Apache
73.2
/100
|
#149
Good
98.1%
Jordanians
72.9
/100
|
#150
Good
98.1%
Soviet Union
71.6
/100
|
#151
Good
98.0%
Dutch West Indians
70.2
/100
|
#152
Good
98.0%
Immigrants | Moldova
69.6
/100
|
#153
Good
98.0%
Immigrants | Iran
68.7
/100
|
#154
Good
98.0%
Immigrants | South Central Asia
66.7
/100
|
#155
Good
98.0%
Venezuelans
66.6
/100
|
#156
Good
98.0%
Comanche
66.0
/100
|
#157
Good
98.0%