Immigrants from Denmark vs Jordanian Family Households
COMPARE
Immigrants from Denmark
Jordanian
Family Households
Family Households Comparison
Immigrants from Denmark
Jordanians
62.9%
FAMILY HOUSEHOLDS
0.1/ 100
METRIC RATING
283rd/ 347
METRIC RANK
65.5%
FAMILY HOUSEHOLDS
99.7/ 100
METRIC RATING
81st/ 347
METRIC RANK
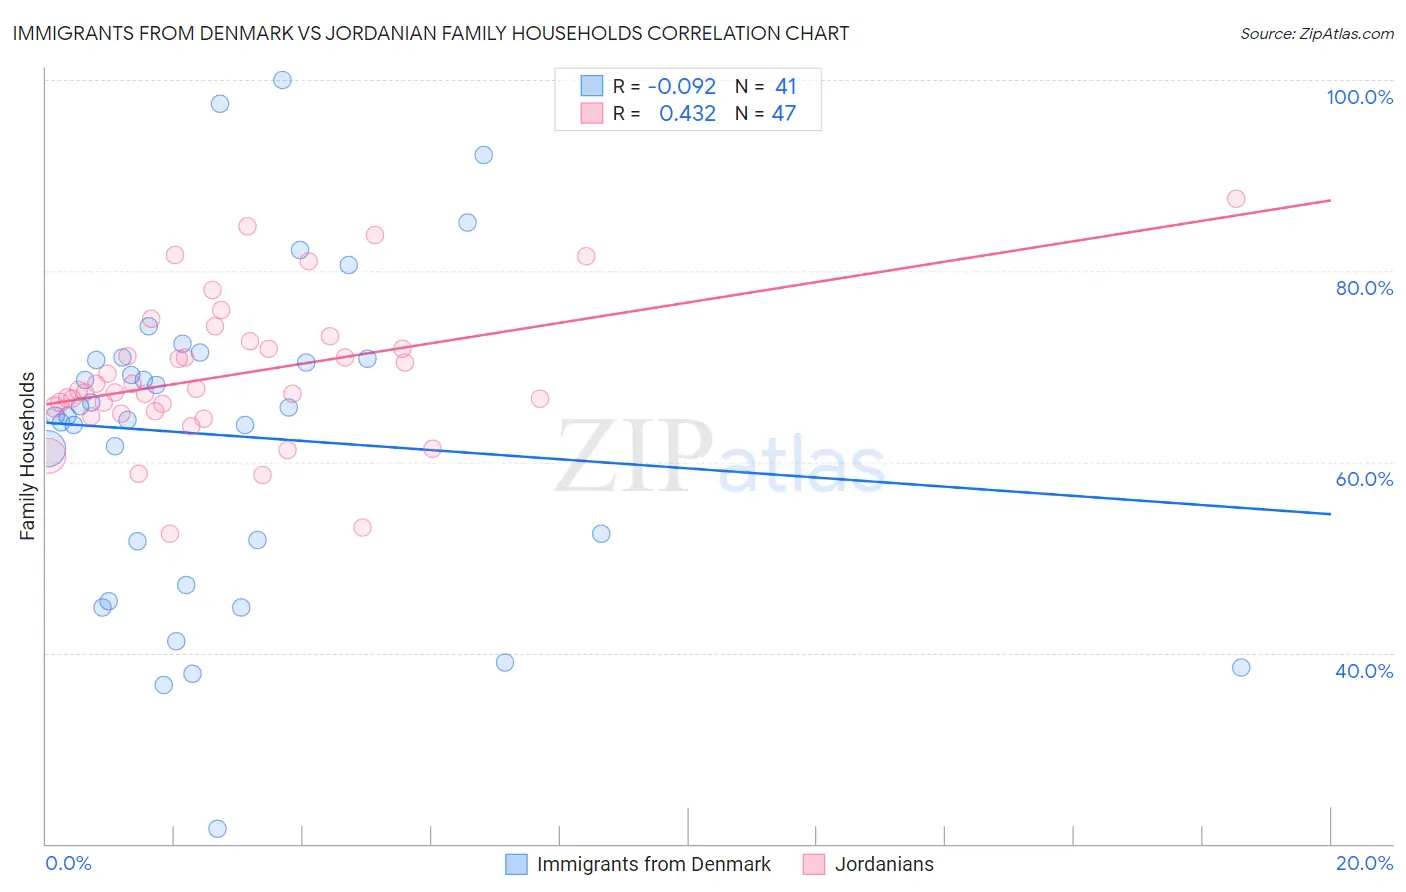
Immigrants from Denmark vs Jordanian Family Households Correlation Chart
The statistical analysis conducted on geographies consisting of 136,405,039 people shows a slight negative correlation between the proportion of Immigrants from Denmark and percentage of family households in the United States with a correlation coefficient (R) of -0.092 and weighted average of 62.9%. Similarly, the statistical analysis conducted on geographies consisting of 166,395,405 people shows a moderate positive correlation between the proportion of Jordanians and percentage of family households in the United States with a correlation coefficient (R) of 0.432 and weighted average of 65.5%, a difference of 4.3%.
Family Households Correlation Summary
| Measurement | Immigrants from Denmark | Jordanian |
| Minimum | 21.6% | 52.5% |
| Maximum | 100.0% | 87.5% |
| Range | 78.4% | 35.0% |
| Mean | 62.7% | 69.1% |
| Median | 64.8% | 67.5% |
| Interquartile 25% (IQ1) | 49.4% | 65.3% |
| Interquartile 75% (IQ3) | 70.9% | 72.6% |
| Interquartile Range (IQR) | 21.5% | 7.3% |
| Standard Deviation (Sample) | 17.0% | 7.5% |
| Standard Deviation (Population) | 16.8% | 7.5% |
Similar Demographics by Family Households
Demographics Similar to Immigrants from Denmark by Family Households
In terms of family households, the demographic groups most similar to Immigrants from Denmark are New Zealander (62.9%, a difference of 0.010%), Estonian (62.9%, a difference of 0.040%), Australian (62.8%, a difference of 0.040%), Immigrants from Bulgaria (63.0%, a difference of 0.13%), and Immigrants from Yemen (63.0%, a difference of 0.15%).
| Demographics | Rating | Rank | Family Households |
| Serbians | 0.3 /100 | #276 | Tragic 63.0% |
| Ottawa | 0.3 /100 | #277 | Tragic 63.0% |
| Immigrants | Belgium | 0.2 /100 | #278 | Tragic 63.0% |
| Immigrants | Yemen | 0.2 /100 | #279 | Tragic 63.0% |
| Immigrants | Bulgaria | 0.2 /100 | #280 | Tragic 63.0% |
| Estonians | 0.2 /100 | #281 | Tragic 62.9% |
| New Zealanders | 0.1 /100 | #282 | Tragic 62.9% |
| Immigrants | Denmark | 0.1 /100 | #283 | Tragic 62.9% |
| Australians | 0.1 /100 | #284 | Tragic 62.8% |
| Mongolians | 0.1 /100 | #285 | Tragic 62.8% |
| British West Indians | 0.1 /100 | #286 | Tragic 62.8% |
| Latvians | 0.1 /100 | #287 | Tragic 62.8% |
| Immigrants | Uganda | 0.1 /100 | #288 | Tragic 62.7% |
| Immigrants | Nepal | 0.1 /100 | #289 | Tragic 62.7% |
| Immigrants | Grenada | 0.0 /100 | #290 | Tragic 62.6% |
Demographics Similar to Jordanians by Family Households
In terms of family households, the demographic groups most similar to Jordanians are Immigrants from Lebanon (65.5%, a difference of 0.040%), Immigrants from Guyana (65.5%, a difference of 0.040%), American (65.5%, a difference of 0.060%), Puget Sound Salish (65.6%, a difference of 0.080%), and Immigrants from Costa Rica (65.6%, a difference of 0.10%).
| Demographics | Rating | Rank | Family Households |
| Burmese | 99.9 /100 | #74 | Exceptional 65.7% |
| Houma | 99.9 /100 | #75 | Exceptional 65.7% |
| Immigrants | Azores | 99.8 /100 | #76 | Exceptional 65.6% |
| Immigrants | South America | 99.8 /100 | #77 | Exceptional 65.6% |
| Yaqui | 99.8 /100 | #78 | Exceptional 65.6% |
| Immigrants | Costa Rica | 99.8 /100 | #79 | Exceptional 65.6% |
| Puget Sound Salish | 99.8 /100 | #80 | Exceptional 65.6% |
| Jordanians | 99.7 /100 | #81 | Exceptional 65.5% |
| Immigrants | Lebanon | 99.7 /100 | #82 | Exceptional 65.5% |
| Immigrants | Guyana | 99.6 /100 | #83 | Exceptional 65.5% |
| Americans | 99.6 /100 | #84 | Exceptional 65.5% |
| Immigrants | Cambodia | 99.5 /100 | #85 | Exceptional 65.4% |
| Egyptians | 99.4 /100 | #86 | Exceptional 65.4% |
| Immigrants | Egypt | 99.2 /100 | #87 | Exceptional 65.3% |
| Immigrants | Haiti | 99.1 /100 | #88 | Exceptional 65.3% |