Immigrants from Grenada vs Australian Poverty
COMPARE
Immigrants from Grenada
Australian
Poverty
Poverty Comparison
Immigrants from Grenada
Australians
15.8%
POVERTY
0.0/ 100
METRIC RATING
313th/ 347
METRIC RANK
11.4%
POVERTY
94.9/ 100
METRIC RATING
95th/ 347
METRIC RANK
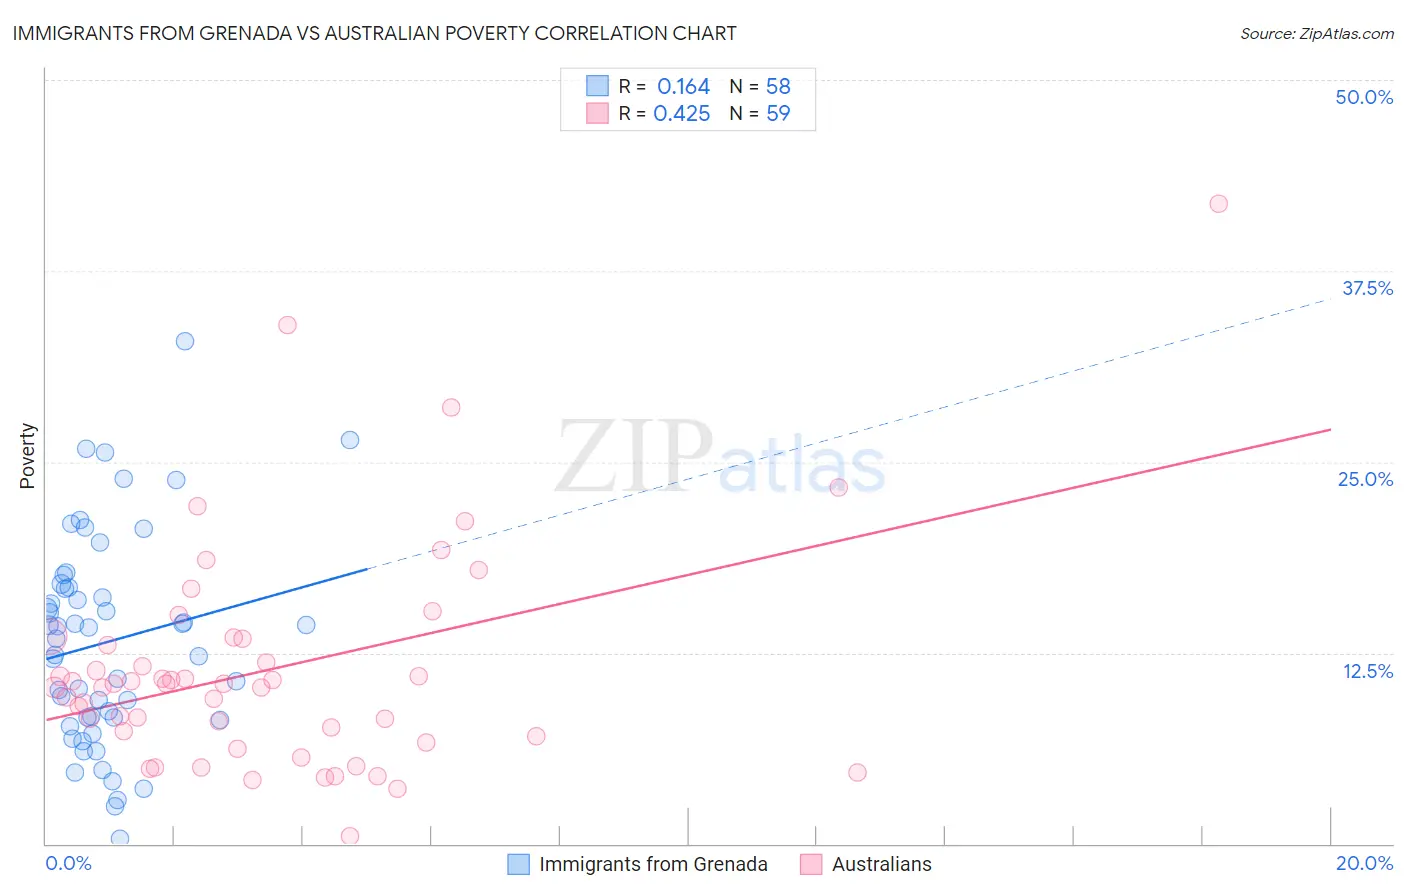
Immigrants from Grenada vs Australian Poverty Correlation Chart
The statistical analysis conducted on geographies consisting of 67,200,374 people shows a poor positive correlation between the proportion of Immigrants from Grenada and poverty level in the United States with a correlation coefficient (R) of 0.164 and weighted average of 15.8%. Similarly, the statistical analysis conducted on geographies consisting of 224,020,538 people shows a moderate positive correlation between the proportion of Australians and poverty level in the United States with a correlation coefficient (R) of 0.425 and weighted average of 11.4%, a difference of 37.8%.
Poverty Correlation Summary
| Measurement | Immigrants from Grenada | Australian |
| Minimum | 0.33% | 0.47% |
| Maximum | 32.9% | 41.9% |
| Range | 32.6% | 41.4% |
| Mean | 13.2% | 11.4% |
| Median | 13.8% | 10.5% |
| Interquartile 25% (IQ1) | 8.2% | 7.0% |
| Interquartile 75% (IQ3) | 16.8% | 13.4% |
| Interquartile Range (IQR) | 8.6% | 6.4% |
| Standard Deviation (Sample) | 6.8% | 7.3% |
| Standard Deviation (Population) | 6.8% | 7.3% |
Similar Demographics by Poverty
Demographics Similar to Immigrants from Grenada by Poverty
In terms of poverty, the demographic groups most similar to Immigrants from Grenada are Immigrants from Somalia (15.8%, a difference of 0.12%), Cajun (15.7%, a difference of 0.44%), British West Indian (15.9%, a difference of 0.49%), Honduran (15.9%, a difference of 0.49%), and Chippewa (15.7%, a difference of 0.60%).
| Demographics | Rating | Rank | Poverty |
| Creek | 0.0 /100 | #306 | Tragic 15.6% |
| Africans | 0.0 /100 | #307 | Tragic 15.6% |
| Choctaw | 0.0 /100 | #308 | Tragic 15.6% |
| Seminole | 0.0 /100 | #309 | Tragic 15.6% |
| Dutch West Indians | 0.0 /100 | #310 | Tragic 15.6% |
| Chippewa | 0.0 /100 | #311 | Tragic 15.7% |
| Cajuns | 0.0 /100 | #312 | Tragic 15.7% |
| Immigrants | Grenada | 0.0 /100 | #313 | Tragic 15.8% |
| Immigrants | Somalia | 0.0 /100 | #314 | Tragic 15.8% |
| British West Indians | 0.0 /100 | #315 | Tragic 15.9% |
| Hondurans | 0.0 /100 | #316 | Tragic 15.9% |
| U.S. Virgin Islanders | 0.0 /100 | #317 | Tragic 16.1% |
| Immigrants | Dominica | 0.0 /100 | #318 | Tragic 16.1% |
| Immigrants | Congo | 0.0 /100 | #319 | Tragic 16.1% |
| Immigrants | Honduras | 0.0 /100 | #320 | Tragic 16.2% |
Demographics Similar to Australians by Poverty
In terms of poverty, the demographic groups most similar to Australians are Paraguayan (11.4%, a difference of 0.0%), Romanian (11.4%, a difference of 0.020%), British (11.4%, a difference of 0.060%), Immigrants from South Africa (11.5%, a difference of 0.12%), and Immigrants from Egypt (11.5%, a difference of 0.15%).
| Demographics | Rating | Rank | Poverty |
| Belgians | 95.8 /100 | #88 | Exceptional 11.4% |
| Czechoslovakians | 95.7 /100 | #89 | Exceptional 11.4% |
| Immigrants | Denmark | 95.5 /100 | #90 | Exceptional 11.4% |
| Finns | 95.2 /100 | #91 | Exceptional 11.4% |
| British | 95.0 /100 | #92 | Exceptional 11.4% |
| Romanians | 94.9 /100 | #93 | Exceptional 11.4% |
| Paraguayans | 94.9 /100 | #94 | Exceptional 11.4% |
| Australians | 94.9 /100 | #95 | Exceptional 11.4% |
| Immigrants | South Africa | 94.7 /100 | #96 | Exceptional 11.5% |
| Immigrants | Egypt | 94.6 /100 | #97 | Exceptional 11.5% |
| Immigrants | Latvia | 94.5 /100 | #98 | Exceptional 11.5% |
| Immigrants | Indonesia | 94.2 /100 | #99 | Exceptional 11.5% |
| Scottish | 94.0 /100 | #100 | Exceptional 11.5% |
| Slavs | 93.3 /100 | #101 | Exceptional 11.5% |
| Laotians | 92.4 /100 | #102 | Exceptional 11.6% |