Immigrants from Denmark vs Australian Single Mother Households
COMPARE
Immigrants from Denmark
Australian
Single Mother Households
Single Mother Households Comparison
Immigrants from Denmark
Australians
5.5%
SINGLE MOTHER HOUSEHOLDS
99.1/ 100
METRIC RATING
55th/ 347
METRIC RANK
5.6%
SINGLE MOTHER HOUSEHOLDS
98.7/ 100
METRIC RATING
61st/ 347
METRIC RANK
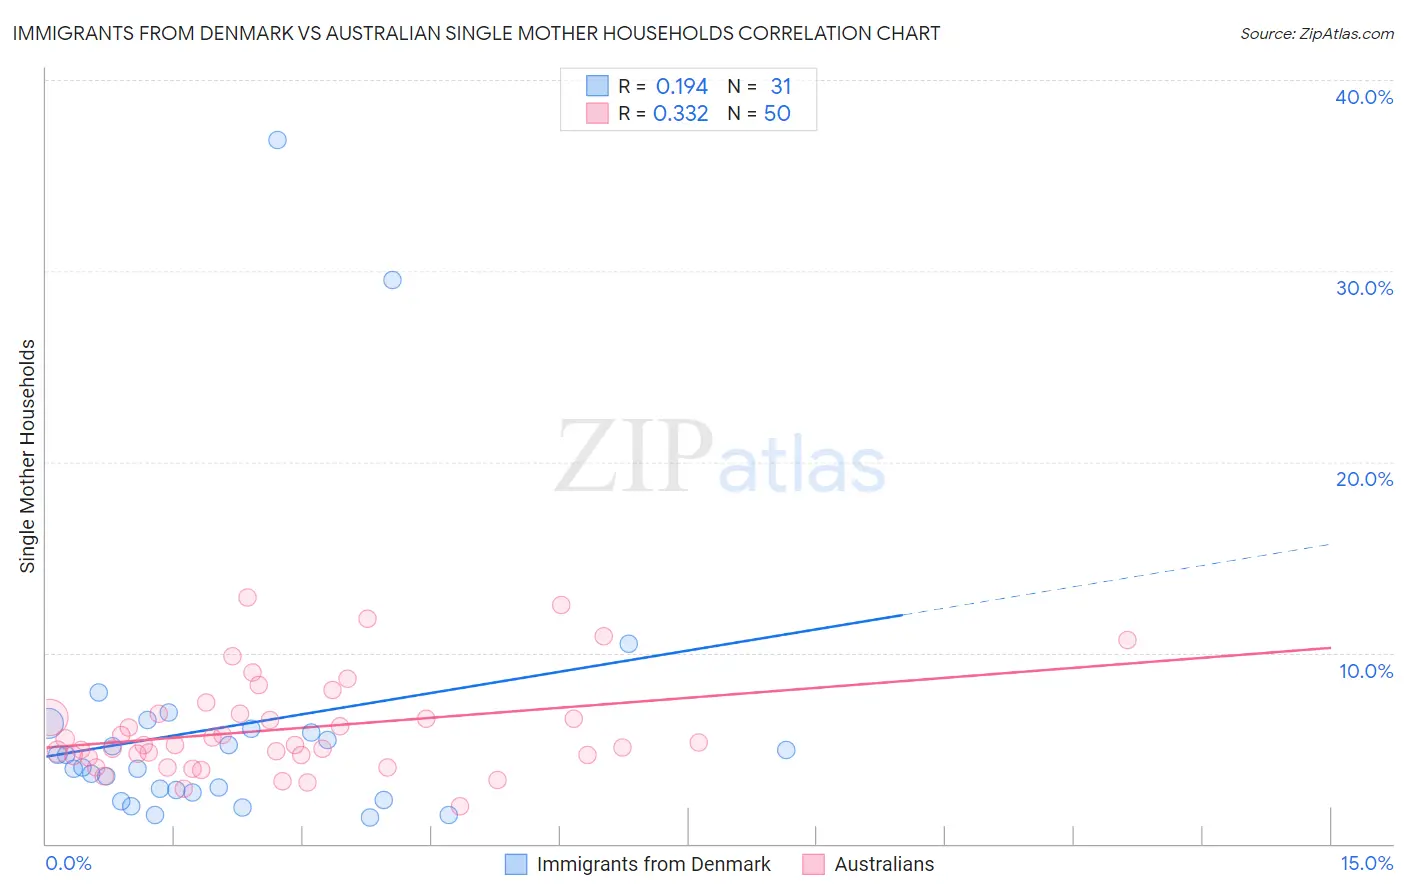
Immigrants from Denmark vs Australian Single Mother Households Correlation Chart
The statistical analysis conducted on geographies consisting of 136,130,833 people shows a poor positive correlation between the proportion of Immigrants from Denmark and percentage of single mother households in the United States with a correlation coefficient (R) of 0.194 and weighted average of 5.5%. Similarly, the statistical analysis conducted on geographies consisting of 223,630,517 people shows a mild positive correlation between the proportion of Australians and percentage of single mother households in the United States with a correlation coefficient (R) of 0.332 and weighted average of 5.6%, a difference of 1.1%.
Single Mother Households Correlation Summary
| Measurement | Immigrants from Denmark | Australian |
| Minimum | 1.4% | 1.9% |
| Maximum | 36.9% | 12.9% |
| Range | 35.5% | 11.0% |
| Mean | 6.1% | 6.0% |
| Median | 4.0% | 5.2% |
| Interquartile 25% (IQ1) | 2.7% | 4.6% |
| Interquartile 75% (IQ3) | 6.0% | 6.8% |
| Interquartile Range (IQR) | 3.3% | 2.2% |
| Standard Deviation (Sample) | 7.6% | 2.5% |
| Standard Deviation (Population) | 7.5% | 2.5% |
Demographics Similar to Immigrants from Denmark and Australians by Single Mother Households
In terms of single mother households, the demographic groups most similar to Immigrants from Denmark are Immigrants from Romania (5.5%, a difference of 0.070%), Immigrants from Europe (5.5%, a difference of 0.15%), Immigrants from Lebanon (5.5%, a difference of 0.17%), Immigrants from Russia (5.5%, a difference of 0.19%), and Swedish (5.5%, a difference of 0.29%). Similarly, the demographic groups most similar to Australians are Polish (5.6%, a difference of 0.010%), Immigrants from Norway (5.6%, a difference of 0.070%), Immigrants from North Macedonia (5.6%, a difference of 0.080%), Immigrants from France (5.6%, a difference of 0.12%), and Greek (5.6%, a difference of 0.16%).
| Demographics | Rating | Rank | Single Mother Households |
| Turks | 99.2 /100 | #48 | Exceptional 5.5% |
| Immigrants | Latvia | 99.2 /100 | #49 | Exceptional 5.5% |
| Immigrants | Scotland | 99.2 /100 | #50 | Exceptional 5.5% |
| Immigrants | Belarus | 99.2 /100 | #51 | Exceptional 5.5% |
| Swedes | 99.1 /100 | #52 | Exceptional 5.5% |
| Immigrants | Russia | 99.1 /100 | #53 | Exceptional 5.5% |
| Immigrants | Lebanon | 99.1 /100 | #54 | Exceptional 5.5% |
| Immigrants | Denmark | 99.1 /100 | #55 | Exceptional 5.5% |
| Immigrants | Romania | 99.0 /100 | #56 | Exceptional 5.5% |
| Immigrants | Europe | 99.0 /100 | #57 | Exceptional 5.5% |
| Danes | 98.9 /100 | #58 | Exceptional 5.5% |
| Luxembourgers | 98.7 /100 | #59 | Exceptional 5.6% |
| Immigrants | Norway | 98.7 /100 | #60 | Exceptional 5.6% |
| Australians | 98.7 /100 | #61 | Exceptional 5.6% |
| Poles | 98.6 /100 | #62 | Exceptional 5.6% |
| Immigrants | North Macedonia | 98.6 /100 | #63 | Exceptional 5.6% |
| Immigrants | France | 98.6 /100 | #64 | Exceptional 5.6% |
| Greeks | 98.6 /100 | #65 | Exceptional 5.6% |
| Immigrants | Canada | 98.5 /100 | #66 | Exceptional 5.6% |
| Italians | 98.5 /100 | #67 | Exceptional 5.6% |
| Immigrants | Bulgaria | 98.5 /100 | #68 | Exceptional 5.6% |