Immigrants from Cuba vs Mongolian Married-Couple Family Poverty
COMPARE
Immigrants from Cuba
Mongolian
Married-Couple Family Poverty
Married-Couple Family Poverty Comparison
Immigrants from Cuba
Mongolians
7.5%
MARRIED-COUPLE FAMILY POVERTY
0.0/ 100
METRIC RATING
325th/ 347
METRIC RANK
5.0%
MARRIED-COUPLE FAMILY POVERTY
79.8/ 100
METRIC RATING
146th/ 347
METRIC RANK
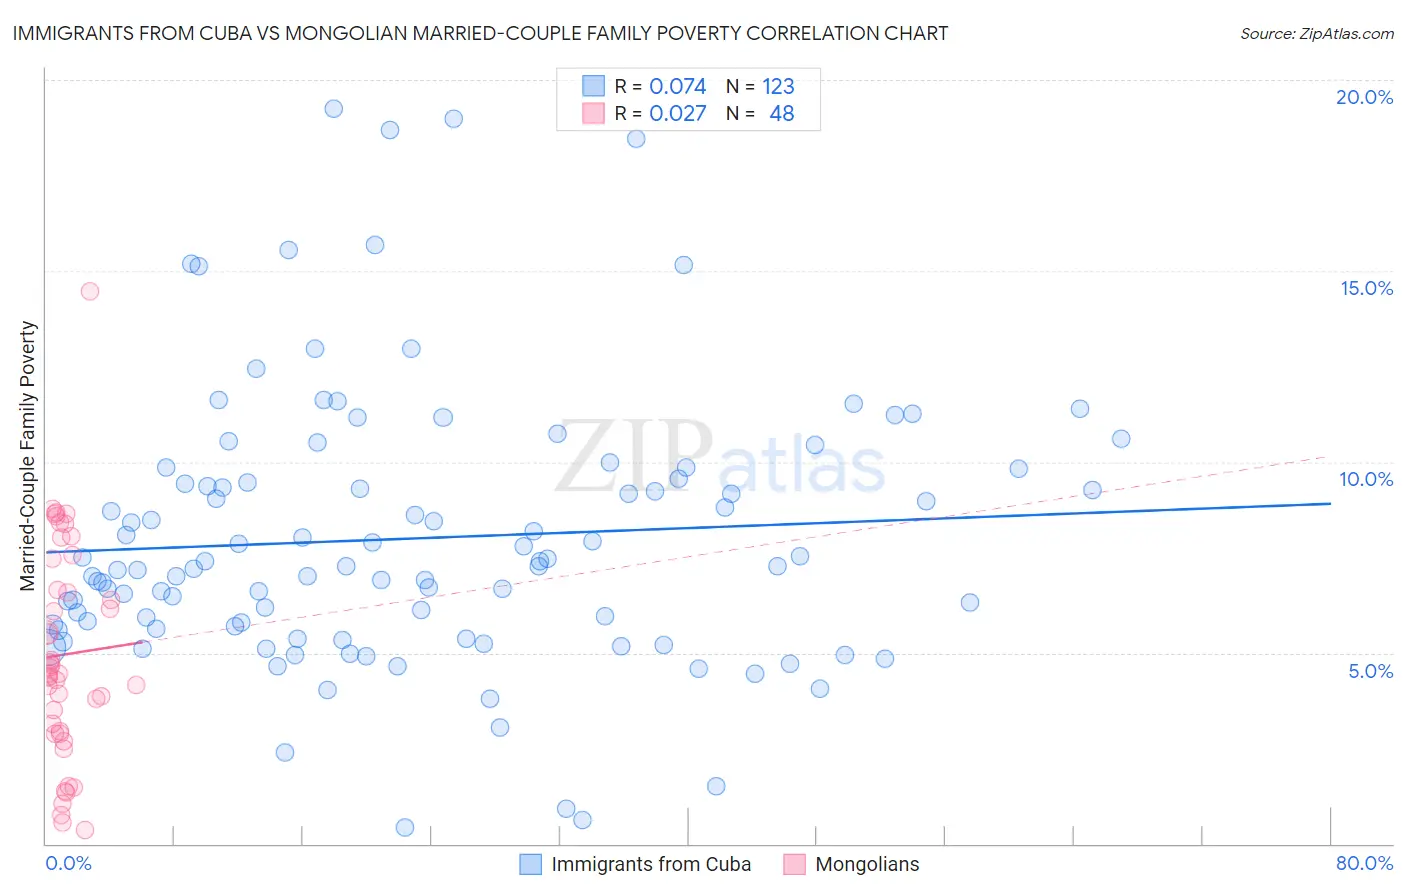
Immigrants from Cuba vs Mongolian Married-Couple Family Poverty Correlation Chart
The statistical analysis conducted on geographies consisting of 324,285,168 people shows a slight positive correlation between the proportion of Immigrants from Cuba and poverty level among married-couple families in the United States with a correlation coefficient (R) of 0.074 and weighted average of 7.5%. Similarly, the statistical analysis conducted on geographies consisting of 139,875,395 people shows no correlation between the proportion of Mongolians and poverty level among married-couple families in the United States with a correlation coefficient (R) of 0.027 and weighted average of 5.0%, a difference of 49.1%.
Married-Couple Family Poverty Correlation Summary
| Measurement | Immigrants from Cuba | Mongolian |
| Minimum | 0.42% | 0.35% |
| Maximum | 19.2% | 14.5% |
| Range | 18.8% | 14.1% |
| Mean | 8.0% | 5.0% |
| Median | 7.3% | 4.5% |
| Interquartile 25% (IQ1) | 5.6% | 2.9% |
| Interquartile 75% (IQ3) | 9.6% | 7.1% |
| Interquartile Range (IQR) | 3.9% | 4.1% |
| Standard Deviation (Sample) | 3.6% | 2.9% |
| Standard Deviation (Population) | 3.6% | 2.8% |
Similar Demographics by Married-Couple Family Poverty
Demographics Similar to Immigrants from Cuba by Married-Couple Family Poverty
In terms of married-couple family poverty, the demographic groups most similar to Immigrants from Cuba are Immigrants from Bangladesh (7.5%, a difference of 0.20%), Hispanic or Latino (7.5%, a difference of 0.20%), Immigrants from Central America (7.4%, a difference of 0.53%), Vietnamese (7.4%, a difference of 0.63%), and Immigrants from Mexico (7.6%, a difference of 1.4%).
| Demographics | Rating | Rank | Married-Couple Family Poverty |
| Immigrants | Guatemala | 0.0 /100 | #318 | Tragic 7.2% |
| Immigrants | Latin America | 0.0 /100 | #319 | Tragic 7.2% |
| Immigrants | Grenada | 0.0 /100 | #320 | Tragic 7.3% |
| Immigrants | Caribbean | 0.0 /100 | #321 | Tragic 7.3% |
| Immigrants | Honduras | 0.0 /100 | #322 | Tragic 7.3% |
| Vietnamese | 0.0 /100 | #323 | Tragic 7.4% |
| Immigrants | Central America | 0.0 /100 | #324 | Tragic 7.4% |
| Immigrants | Cuba | 0.0 /100 | #325 | Tragic 7.5% |
| Immigrants | Bangladesh | 0.0 /100 | #326 | Tragic 7.5% |
| Hispanics or Latinos | 0.0 /100 | #327 | Tragic 7.5% |
| Immigrants | Mexico | 0.0 /100 | #328 | Tragic 7.6% |
| Natives/Alaskans | 0.0 /100 | #329 | Tragic 8.2% |
| Paiute | 0.0 /100 | #330 | Tragic 8.3% |
| Central American Indians | 0.0 /100 | #331 | Tragic 8.3% |
| Dominicans | 0.0 /100 | #332 | Tragic 8.3% |
Demographics Similar to Mongolians by Married-Couple Family Poverty
In terms of married-couple family poverty, the demographic groups most similar to Mongolians are Immigrants from Spain (5.0%, a difference of 0.020%), Syrian (5.0%, a difference of 0.19%), Immigrants from Russia (5.0%, a difference of 0.20%), Immigrants from Oceania (5.0%, a difference of 0.22%), and Brazilian (5.0%, a difference of 0.27%).
| Demographics | Rating | Rank | Married-Couple Family Poverty |
| German Russians | 85.1 /100 | #139 | Excellent 5.0% |
| Immigrants | Portugal | 84.8 /100 | #140 | Excellent 5.0% |
| Immigrants | Brazil | 84.6 /100 | #141 | Excellent 5.0% |
| Immigrants | China | 84.6 /100 | #142 | Excellent 5.0% |
| Immigrants | Egypt | 83.4 /100 | #143 | Excellent 5.0% |
| Hmong | 83.2 /100 | #144 | Excellent 5.0% |
| Immigrants | Spain | 79.9 /100 | #145 | Good 5.0% |
| Mongolians | 79.8 /100 | #146 | Good 5.0% |
| Syrians | 78.7 /100 | #147 | Good 5.0% |
| Immigrants | Russia | 78.7 /100 | #148 | Good 5.0% |
| Immigrants | Oceania | 78.6 /100 | #149 | Good 5.0% |
| Brazilians | 78.3 /100 | #150 | Good 5.0% |
| Immigrants | Cameroon | 77.3 /100 | #151 | Good 5.0% |
| Albanians | 77.2 /100 | #152 | Good 5.0% |
| Immigrants | Kuwait | 76.3 /100 | #153 | Good 5.0% |