Immigrants from Guatemala vs Japanese Family Poverty
COMPARE
Immigrants from Guatemala
Japanese
Family Poverty
Family Poverty Comparison
Immigrants from Guatemala
Japanese
12.0%
FAMILY POVERTY
0.0/ 100
METRIC RATING
310th/ 347
METRIC RANK
9.9%
FAMILY POVERTY
4.8/ 100
METRIC RATING
222nd/ 347
METRIC RANK
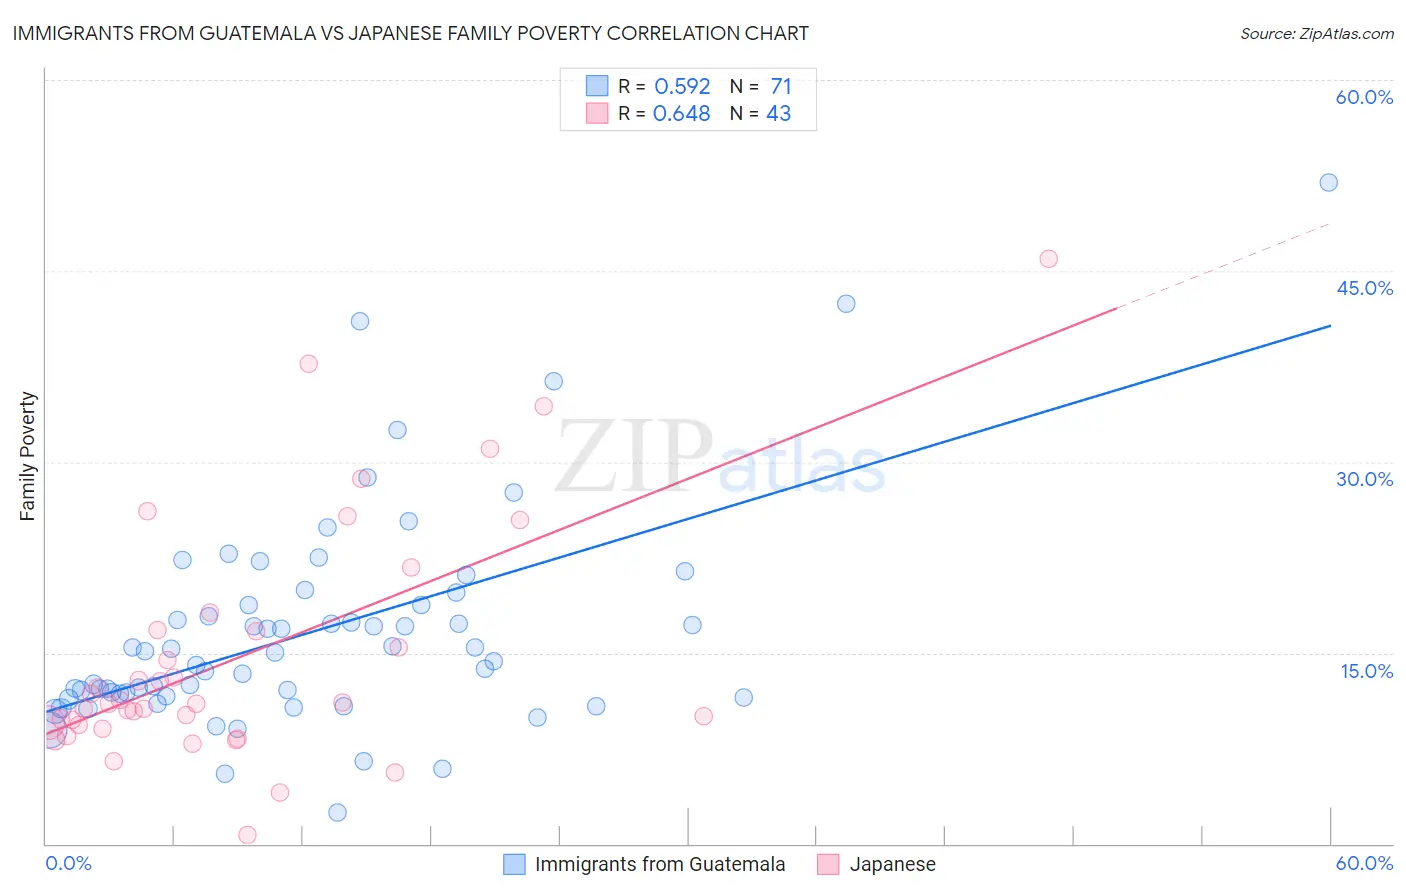
Immigrants from Guatemala vs Japanese Family Poverty Correlation Chart
The statistical analysis conducted on geographies consisting of 376,740,160 people shows a substantial positive correlation between the proportion of Immigrants from Guatemala and poverty level among families in the United States with a correlation coefficient (R) of 0.592 and weighted average of 12.0%. Similarly, the statistical analysis conducted on geographies consisting of 248,852,848 people shows a significant positive correlation between the proportion of Japanese and poverty level among families in the United States with a correlation coefficient (R) of 0.648 and weighted average of 9.9%, a difference of 20.9%.
Family Poverty Correlation Summary
| Measurement | Immigrants from Guatemala | Japanese |
| Minimum | 2.5% | 0.66% |
| Maximum | 51.9% | 45.9% |
| Range | 49.4% | 45.3% |
| Mean | 16.7% | 14.7% |
| Median | 15.1% | 11.0% |
| Interquartile 25% (IQ1) | 11.6% | 9.3% |
| Interquartile 75% (IQ3) | 18.8% | 16.8% |
| Interquartile Range (IQR) | 7.2% | 7.5% |
| Standard Deviation (Sample) | 8.6% | 9.5% |
| Standard Deviation (Population) | 8.5% | 9.4% |
Similar Demographics by Family Poverty
Demographics Similar to Immigrants from Guatemala by Family Poverty
In terms of family poverty, the demographic groups most similar to Immigrants from Guatemala are Hispanic or Latino (12.0%, a difference of 0.0%), Seminole (11.9%, a difference of 0.45%), Immigrants from Congo (11.9%, a difference of 0.51%), Cajun (11.9%, a difference of 0.62%), and Ute (12.1%, a difference of 0.84%).
| Demographics | Rating | Rank | Family Poverty |
| Africans | 0.0 /100 | #303 | Tragic 11.8% |
| Immigrants | Latin America | 0.0 /100 | #304 | Tragic 11.8% |
| Mexicans | 0.0 /100 | #305 | Tragic 11.8% |
| Cajuns | 0.0 /100 | #306 | Tragic 11.9% |
| Immigrants | Congo | 0.0 /100 | #307 | Tragic 11.9% |
| Seminole | 0.0 /100 | #308 | Tragic 11.9% |
| Hispanics or Latinos | 0.0 /100 | #309 | Tragic 12.0% |
| Immigrants | Guatemala | 0.0 /100 | #310 | Tragic 12.0% |
| Ute | 0.0 /100 | #311 | Tragic 12.1% |
| Immigrants | Central America | 0.0 /100 | #312 | Tragic 12.1% |
| Immigrants | Caribbean | 0.0 /100 | #313 | Tragic 12.2% |
| Kiowa | 0.0 /100 | #314 | Tragic 12.2% |
| Immigrants | Mexico | 0.0 /100 | #315 | Tragic 12.3% |
| Hondurans | 0.0 /100 | #316 | Tragic 12.4% |
| Immigrants | Grenada | 0.0 /100 | #317 | Tragic 12.4% |
Demographics Similar to Japanese by Family Poverty
In terms of family poverty, the demographic groups most similar to Japanese are Immigrants from Cambodia (9.9%, a difference of 0.030%), Immigrants from Africa (9.9%, a difference of 0.30%), Bermudan (9.9%, a difference of 0.31%), Immigrants from Eritrea (9.9%, a difference of 0.36%), and Panamanian (9.8%, a difference of 0.49%).
| Demographics | Rating | Rank | Family Poverty |
| Immigrants | Nonimmigrants | 6.7 /100 | #215 | Tragic 9.8% |
| Moroccans | 6.5 /100 | #216 | Tragic 9.8% |
| Americans | 6.2 /100 | #217 | Tragic 9.8% |
| Panamanians | 5.6 /100 | #218 | Tragic 9.8% |
| Immigrants | Eritrea | 5.4 /100 | #219 | Tragic 9.9% |
| Bermudans | 5.3 /100 | #220 | Tragic 9.9% |
| Immigrants | Cambodia | 4.8 /100 | #221 | Tragic 9.9% |
| Japanese | 4.8 /100 | #222 | Tragic 9.9% |
| Immigrants | Africa | 4.3 /100 | #223 | Tragic 9.9% |
| Marshallese | 3.9 /100 | #224 | Tragic 9.9% |
| Immigrants | Immigrants | 3.6 /100 | #225 | Tragic 10.0% |
| Ottawa | 3.3 /100 | #226 | Tragic 10.0% |
| Immigrants | Armenia | 3.3 /100 | #227 | Tragic 10.0% |
| Sudanese | 3.1 /100 | #228 | Tragic 10.0% |
| Immigrants | Uzbekistan | 3.1 /100 | #229 | Tragic 10.0% |