Immigrants from Costa Rica vs Nepalese Male Poverty
COMPARE
Immigrants from Costa Rica
Nepalese
Male Poverty
Male Poverty Comparison
Immigrants from Costa Rica
Nepalese
11.3%
MALE POVERTY
39.5/ 100
METRIC RATING
181st/ 347
METRIC RANK
12.8%
MALE POVERTY
0.3/ 100
METRIC RATING
242nd/ 347
METRIC RANK
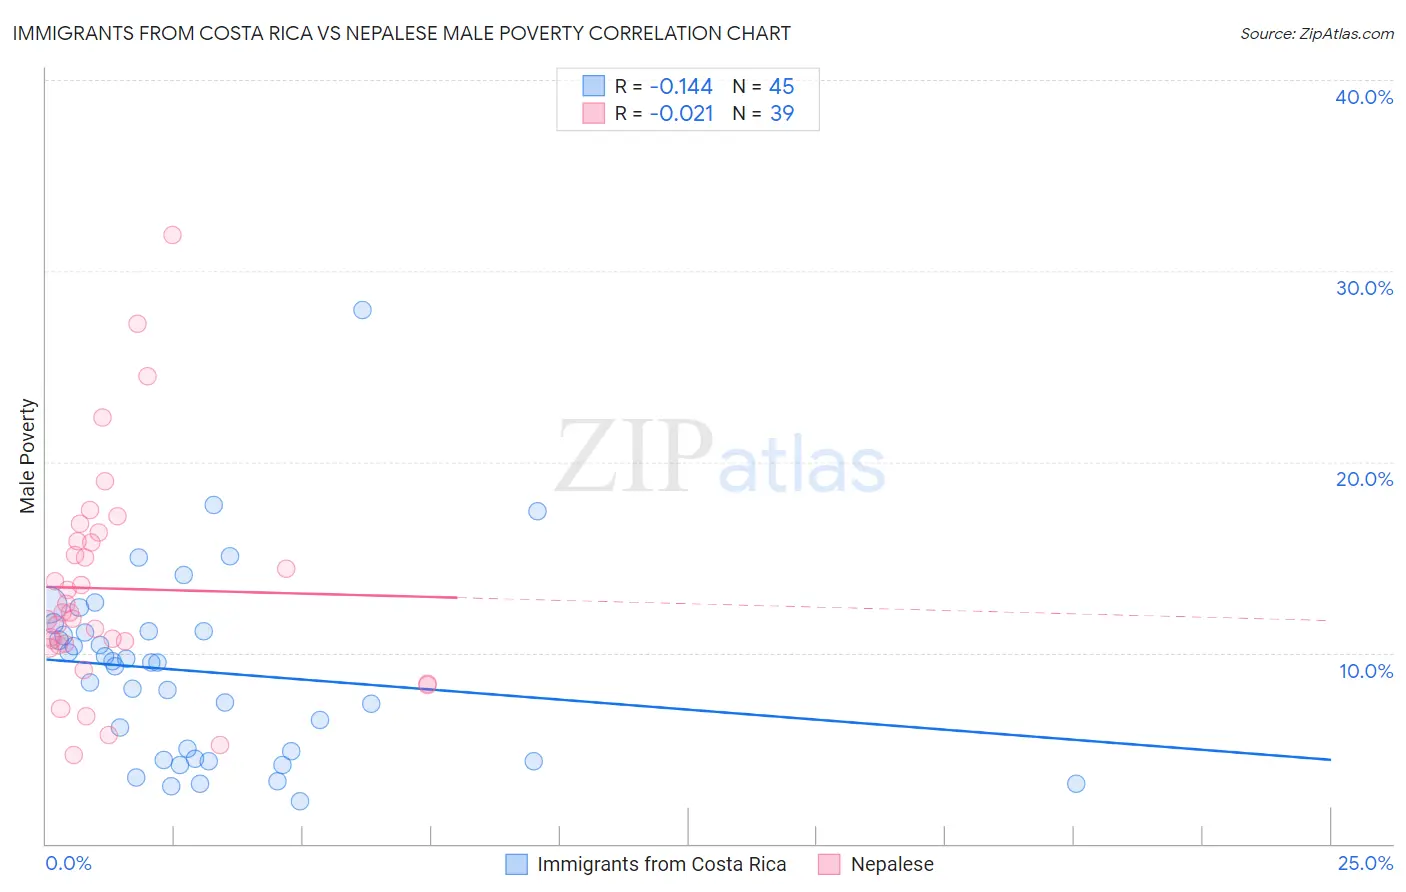
Immigrants from Costa Rica vs Nepalese Male Poverty Correlation Chart
The statistical analysis conducted on geographies consisting of 204,239,377 people shows a poor negative correlation between the proportion of Immigrants from Costa Rica and poverty level among males in the United States with a correlation coefficient (R) of -0.144 and weighted average of 11.3%. Similarly, the statistical analysis conducted on geographies consisting of 24,519,269 people shows no correlation between the proportion of Nepalese and poverty level among males in the United States with a correlation coefficient (R) of -0.021 and weighted average of 12.8%, a difference of 13.1%.
Male Poverty Correlation Summary
| Measurement | Immigrants from Costa Rica | Nepalese |
| Minimum | 2.3% | 4.7% |
| Maximum | 28.0% | 31.9% |
| Range | 25.7% | 27.2% |
| Mean | 9.0% | 13.4% |
| Median | 9.5% | 12.1% |
| Interquartile 25% (IQ1) | 4.4% | 10.4% |
| Interquartile 75% (IQ3) | 11.1% | 15.8% |
| Interquartile Range (IQR) | 6.7% | 5.4% |
| Standard Deviation (Sample) | 4.9% | 5.8% |
| Standard Deviation (Population) | 4.9% | 5.7% |
Similar Demographics by Male Poverty
Demographics Similar to Immigrants from Costa Rica by Male Poverty
In terms of male poverty, the demographic groups most similar to Immigrants from Costa Rica are Mongolian (11.3%, a difference of 0.050%), Immigrants from Morocco (11.3%, a difference of 0.060%), Immigrants from Syria (11.3%, a difference of 0.080%), Kenyan (11.3%, a difference of 0.11%), and Immigrants from South America (11.3%, a difference of 0.27%).
| Demographics | Rating | Rank | Male Poverty |
| Immigrants | Oceania | 50.0 /100 | #174 | Average 11.2% |
| Celtics | 47.5 /100 | #175 | Average 11.2% |
| Immigrants | Fiji | 46.0 /100 | #176 | Average 11.2% |
| Lebanese | 45.6 /100 | #177 | Average 11.2% |
| Immigrants | Cameroon | 44.5 /100 | #178 | Average 11.2% |
| Immigrants | Syria | 40.3 /100 | #179 | Average 11.3% |
| Immigrants | Morocco | 40.1 /100 | #180 | Average 11.3% |
| Immigrants | Costa Rica | 39.5 /100 | #181 | Fair 11.3% |
| Mongolians | 39.0 /100 | #182 | Fair 11.3% |
| Kenyans | 38.4 /100 | #183 | Fair 11.3% |
| Immigrants | South America | 36.9 /100 | #184 | Fair 11.3% |
| Immigrants | Afghanistan | 33.3 /100 | #185 | Fair 11.4% |
| Immigrants | Sierra Leone | 32.9 /100 | #186 | Fair 11.4% |
| Immigrants | Iraq | 31.9 /100 | #187 | Fair 11.4% |
| Sierra Leoneans | 29.9 /100 | #188 | Fair 11.4% |
Demographics Similar to Nepalese by Male Poverty
In terms of male poverty, the demographic groups most similar to Nepalese are Alaskan Athabascan (12.8%, a difference of 0.040%), Tsimshian (12.8%, a difference of 0.14%), Liberian (12.8%, a difference of 0.16%), Sudanese (12.8%, a difference of 0.17%), and Immigrants from El Salvador (12.8%, a difference of 0.46%).
| Demographics | Rating | Rank | Male Poverty |
| Immigrants | Laos | 0.5 /100 | #235 | Tragic 12.6% |
| Immigrants | Saudi Arabia | 0.4 /100 | #236 | Tragic 12.7% |
| French American Indians | 0.4 /100 | #237 | Tragic 12.7% |
| Ecuadorians | 0.4 /100 | #238 | Tragic 12.7% |
| Ghanaians | 0.4 /100 | #239 | Tragic 12.7% |
| Immigrants | Middle Africa | 0.4 /100 | #240 | Tragic 12.7% |
| Sudanese | 0.3 /100 | #241 | Tragic 12.8% |
| Nepalese | 0.3 /100 | #242 | Tragic 12.8% |
| Alaskan Athabascans | 0.3 /100 | #243 | Tragic 12.8% |
| Tsimshian | 0.3 /100 | #244 | Tragic 12.8% |
| Liberians | 0.3 /100 | #245 | Tragic 12.8% |
| Immigrants | El Salvador | 0.2 /100 | #246 | Tragic 12.8% |
| Immigrants | Western Africa | 0.2 /100 | #247 | Tragic 12.9% |
| Immigrants | Sudan | 0.2 /100 | #248 | Tragic 12.9% |
| Potawatomi | 0.2 /100 | #249 | Tragic 12.9% |