Immigrants from Congo vs Filipino Child Poverty Under the Age of 16
COMPARE
Immigrants from Congo
Filipino
Child Poverty Under the Age of 16
Child Poverty Under the Age of 16 Comparison
Immigrants from Congo
Filipinos
22.5%
CHILD POVERTY UNDER THE AGE OF 16
0.0/ 100
METRIC RATING
325th/ 347
METRIC RANK
11.1%
CHILD POVERTY UNDER THE AGE OF 16
100.0/ 100
METRIC RATING
3rd/ 347
METRIC RANK
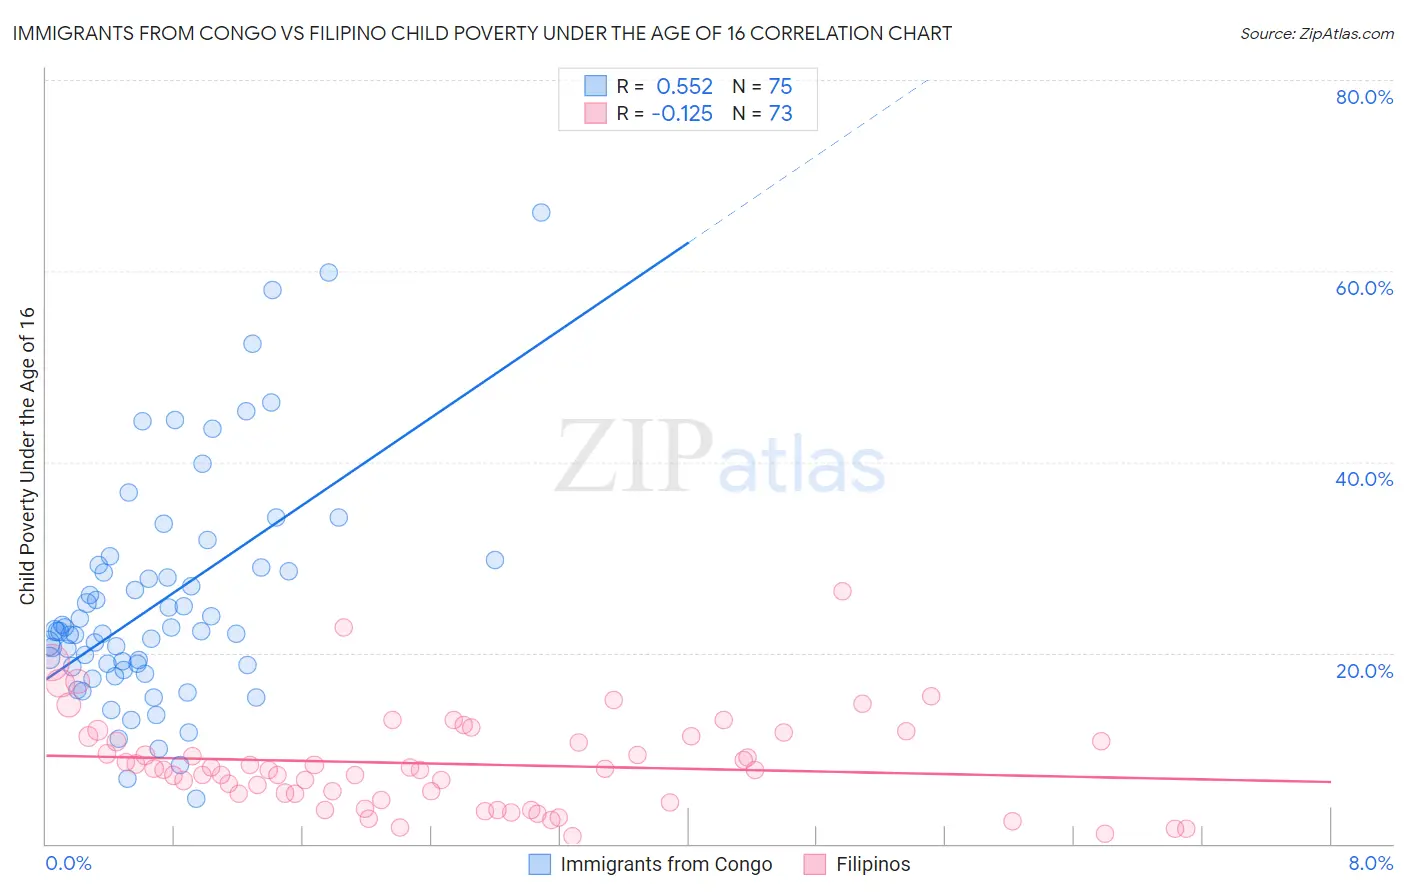
Immigrants from Congo vs Filipino Child Poverty Under the Age of 16 Correlation Chart
The statistical analysis conducted on geographies consisting of 92,037,076 people shows a substantial positive correlation between the proportion of Immigrants from Congo and poverty level among children under the age of 16 in the United States with a correlation coefficient (R) of 0.552 and weighted average of 22.5%. Similarly, the statistical analysis conducted on geographies consisting of 252,527,529 people shows a poor negative correlation between the proportion of Filipinos and poverty level among children under the age of 16 in the United States with a correlation coefficient (R) of -0.125 and weighted average of 11.1%, a difference of 102.3%.
Child Poverty Under the Age of 16 Correlation Summary
| Measurement | Immigrants from Congo | Filipino |
| Minimum | 4.7% | 0.84% |
| Maximum | 66.1% | 26.4% |
| Range | 61.5% | 25.5% |
| Mean | 25.3% | 8.4% |
| Median | 22.2% | 7.8% |
| Interquartile 25% (IQ1) | 18.5% | 4.9% |
| Interquartile 75% (IQ3) | 28.9% | 11.2% |
| Interquartile Range (IQR) | 10.4% | 6.3% |
| Standard Deviation (Sample) | 12.0% | 5.0% |
| Standard Deviation (Population) | 11.9% | 4.9% |
Similar Demographics by Child Poverty Under the Age of 16
Demographics Similar to Immigrants from Congo by Child Poverty Under the Age of 16
In terms of child poverty under the age of 16, the demographic groups most similar to Immigrants from Congo are Central American Indian (22.5%, a difference of 0.14%), Paiute (22.4%, a difference of 0.45%), Immigrants from Honduras (22.7%, a difference of 0.81%), Honduran (22.2%, a difference of 1.5%), and Kiowa (22.2%, a difference of 1.7%).
| Demographics | Rating | Rank | Child Poverty Under the Age of 16 |
| U.S. Virgin Islanders | 0.0 /100 | #318 | Tragic 22.0% |
| Yakama | 0.0 /100 | #319 | Tragic 22.1% |
| Cajuns | 0.0 /100 | #320 | Tragic 22.1% |
| Kiowa | 0.0 /100 | #321 | Tragic 22.2% |
| Hondurans | 0.0 /100 | #322 | Tragic 22.2% |
| Paiute | 0.0 /100 | #323 | Tragic 22.4% |
| Central American Indians | 0.0 /100 | #324 | Tragic 22.5% |
| Immigrants | Congo | 0.0 /100 | #325 | Tragic 22.5% |
| Immigrants | Honduras | 0.0 /100 | #326 | Tragic 22.7% |
| Menominee | 0.0 /100 | #327 | Tragic 23.0% |
| Colville | 0.0 /100 | #328 | Tragic 23.0% |
| Dominicans | 0.0 /100 | #329 | Tragic 23.8% |
| Natives/Alaskans | 0.0 /100 | #330 | Tragic 23.8% |
| Apache | 0.0 /100 | #331 | Tragic 23.8% |
| Pueblo | 0.0 /100 | #332 | Tragic 23.9% |
Demographics Similar to Filipinos by Child Poverty Under the Age of 16
In terms of child poverty under the age of 16, the demographic groups most similar to Filipinos are Immigrants from Taiwan (11.0%, a difference of 0.85%), Immigrants from India (10.8%, a difference of 3.4%), Thai (11.6%, a difference of 3.9%), Chinese (11.9%, a difference of 7.1%), and Immigrants from Hong Kong (12.1%, a difference of 9.0%).
| Demographics | Rating | Rank | Child Poverty Under the Age of 16 |
| Immigrants | India | 100.0 /100 | #1 | Exceptional 10.8% |
| Immigrants | Taiwan | 100.0 /100 | #2 | Exceptional 11.0% |
| Filipinos | 100.0 /100 | #3 | Exceptional 11.1% |
| Thais | 100.0 /100 | #4 | Exceptional 11.6% |
| Chinese | 100.0 /100 | #5 | Exceptional 11.9% |
| Immigrants | Hong Kong | 100.0 /100 | #6 | Exceptional 12.1% |
| Iranians | 100.0 /100 | #7 | Exceptional 12.2% |
| Immigrants | Singapore | 100.0 /100 | #8 | Exceptional 12.4% |
| Immigrants | Iran | 100.0 /100 | #9 | Exceptional 12.4% |
| Immigrants | South Central Asia | 99.9 /100 | #10 | Exceptional 12.5% |
| Bhutanese | 99.9 /100 | #11 | Exceptional 12.5% |
| Immigrants | Ireland | 99.9 /100 | #12 | Exceptional 12.7% |
| Burmese | 99.9 /100 | #13 | Exceptional 12.8% |
| Immigrants | Lithuania | 99.9 /100 | #14 | Exceptional 12.9% |
| Immigrants | Korea | 99.9 /100 | #15 | Exceptional 13.0% |