Immigrants from Congo vs Barbadian Child Poverty Among Girls Under 16
COMPARE
Immigrants from Congo
Barbadian
Child Poverty Among Girls Under 16
Child Poverty Among Girls Under 16 Comparison
Immigrants from Congo
Barbadians
22.7%
CHILD POVERTY AMONG GIRLS UNDER 16
0.0/ 100
METRIC RATING
325th/ 347
METRIC RANK
20.2%
CHILD POVERTY AMONG GIRLS UNDER 16
0.0/ 100
METRIC RATING
278th/ 347
METRIC RANK
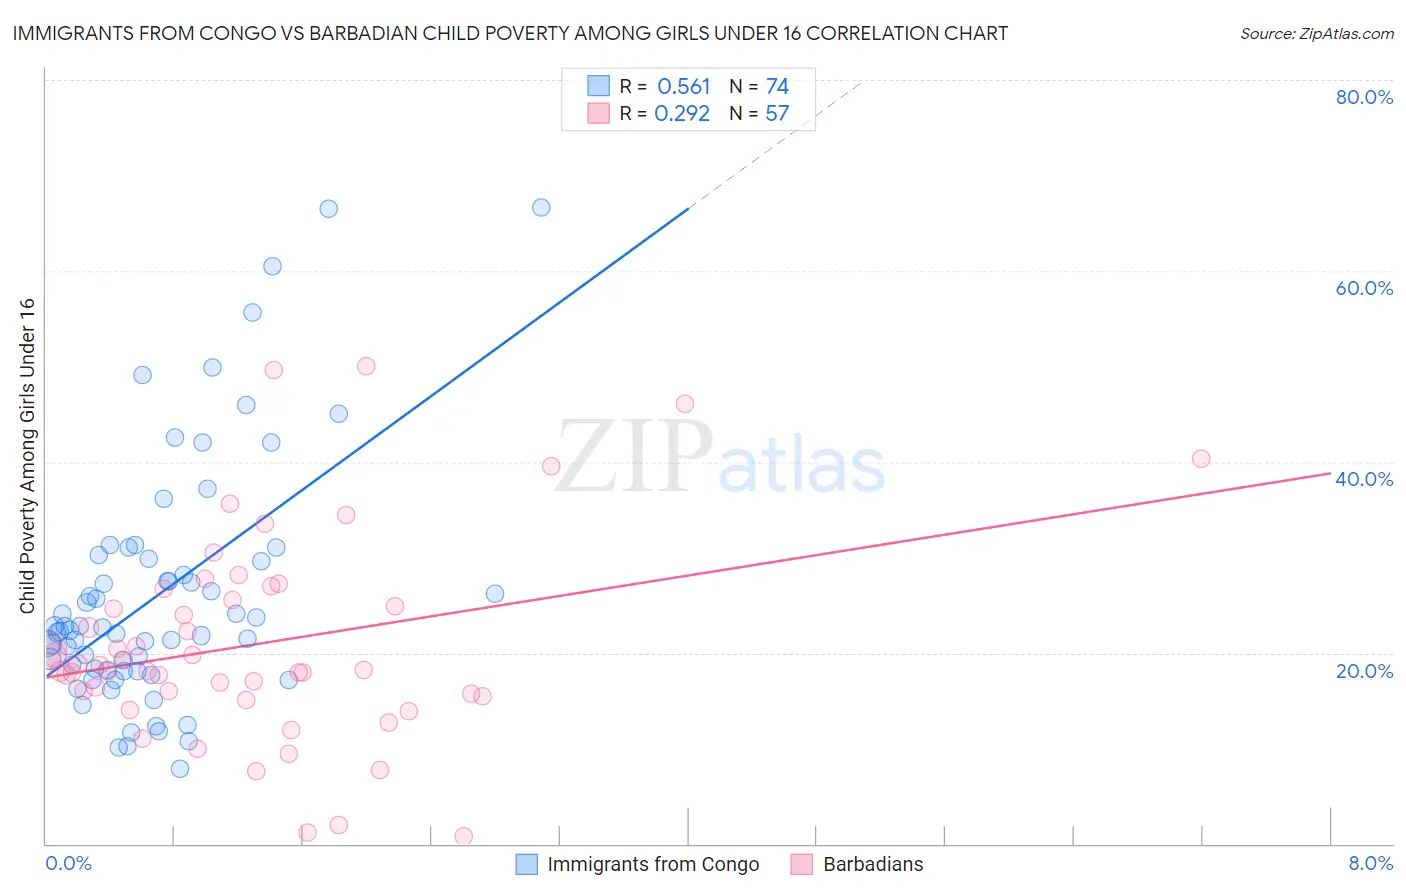
Immigrants from Congo vs Barbadian Child Poverty Among Girls Under 16 Correlation Chart
The statistical analysis conducted on geographies consisting of 91,922,070 people shows a substantial positive correlation between the proportion of Immigrants from Congo and poverty level among girls under the age of 16 in the United States with a correlation coefficient (R) of 0.561 and weighted average of 22.7%. Similarly, the statistical analysis conducted on geographies consisting of 140,329,211 people shows a weak positive correlation between the proportion of Barbadians and poverty level among girls under the age of 16 in the United States with a correlation coefficient (R) of 0.292 and weighted average of 20.2%, a difference of 12.6%.
Child Poverty Among Girls Under 16 Correlation Summary
| Measurement | Immigrants from Congo | Barbadian |
| Minimum | 7.9% | 0.73% |
| Maximum | 66.7% | 50.0% |
| Range | 58.8% | 49.3% |
| Mean | 26.1% | 20.9% |
| Median | 22.5% | 18.2% |
| Interquartile 25% (IQ1) | 18.2% | 15.6% |
| Interquartile 75% (IQ3) | 29.8% | 26.1% |
| Interquartile Range (IQR) | 11.7% | 10.5% |
| Standard Deviation (Sample) | 12.7% | 10.6% |
| Standard Deviation (Population) | 12.6% | 10.5% |
Similar Demographics by Child Poverty Among Girls Under 16
Demographics Similar to Immigrants from Congo by Child Poverty Among Girls Under 16
In terms of child poverty among girls under 16, the demographic groups most similar to Immigrants from Congo are Immigrants from Honduras (22.8%, a difference of 0.13%), Central American Indian (22.8%, a difference of 0.27%), Paiute (22.6%, a difference of 0.50%), Cajun (22.6%, a difference of 0.79%), and Yakama (22.6%, a difference of 0.80%).
| Demographics | Rating | Rank | Child Poverty Among Girls Under 16 |
| Immigrants | Dominica | 0.0 /100 | #318 | Tragic 22.1% |
| U.S. Virgin Islanders | 0.0 /100 | #319 | Tragic 22.1% |
| Hondurans | 0.0 /100 | #320 | Tragic 22.2% |
| Colville | 0.0 /100 | #321 | Tragic 22.5% |
| Yakama | 0.0 /100 | #322 | Tragic 22.6% |
| Cajuns | 0.0 /100 | #323 | Tragic 22.6% |
| Paiute | 0.0 /100 | #324 | Tragic 22.6% |
| Immigrants | Congo | 0.0 /100 | #325 | Tragic 22.7% |
| Immigrants | Honduras | 0.0 /100 | #326 | Tragic 22.8% |
| Central American Indians | 0.0 /100 | #327 | Tragic 22.8% |
| Dominicans | 0.0 /100 | #328 | Tragic 23.7% |
| Kiowa | 0.0 /100 | #329 | Tragic 23.7% |
| Immigrants | Dominican Republic | 0.0 /100 | #330 | Tragic 23.8% |
| Apache | 0.0 /100 | #331 | Tragic 23.8% |
| Natives/Alaskans | 0.0 /100 | #332 | Tragic 24.0% |
Demographics Similar to Barbadians by Child Poverty Among Girls Under 16
In terms of child poverty among girls under 16, the demographic groups most similar to Barbadians are Belizean (20.2%, a difference of 0.030%), Immigrants from Zaire (20.2%, a difference of 0.13%), Comanche (20.2%, a difference of 0.14%), Immigrants from Liberia (20.2%, a difference of 0.14%), and Central American (20.2%, a difference of 0.21%).
| Demographics | Rating | Rank | Child Poverty Among Girls Under 16 |
| Immigrants | Barbados | 0.1 /100 | #271 | Tragic 19.9% |
| Immigrants | El Salvador | 0.1 /100 | #272 | Tragic 20.0% |
| Bangladeshis | 0.1 /100 | #273 | Tragic 20.0% |
| Immigrants | St. Vincent and the Grenadines | 0.0 /100 | #274 | Tragic 20.1% |
| Sub-Saharan Africans | 0.0 /100 | #275 | Tragic 20.1% |
| Comanche | 0.0 /100 | #276 | Tragic 20.2% |
| Belizeans | 0.0 /100 | #277 | Tragic 20.2% |
| Barbadians | 0.0 /100 | #278 | Tragic 20.2% |
| Immigrants | Zaire | 0.0 /100 | #279 | Tragic 20.2% |
| Immigrants | Liberia | 0.0 /100 | #280 | Tragic 20.2% |
| Central Americans | 0.0 /100 | #281 | Tragic 20.2% |
| West Indians | 0.0 /100 | #282 | Tragic 20.3% |
| Senegalese | 0.0 /100 | #283 | Tragic 20.3% |
| Yaqui | 0.0 /100 | #284 | Tragic 20.3% |
| Immigrants | Cabo Verde | 0.0 /100 | #285 | Tragic 20.3% |