Immigrants from China vs Immigrants from Greece Female Poverty Among 18-24 Year Olds
COMPARE
Immigrants from China
Immigrants from Greece
Female Poverty Among 18-24 Year Olds
Female Poverty Among 18-24 Year Olds Comparison
Immigrants from China
Immigrants from Greece
20.2%
FEMALE POVERTY AMONG 18-24 YEAR OLDS
43.0/ 100
METRIC RATING
181st/ 347
METRIC RANK
17.9%
FEMALE POVERTY AMONG 18-24 YEAR OLDS
100.0/ 100
METRIC RATING
35th/ 347
METRIC RANK
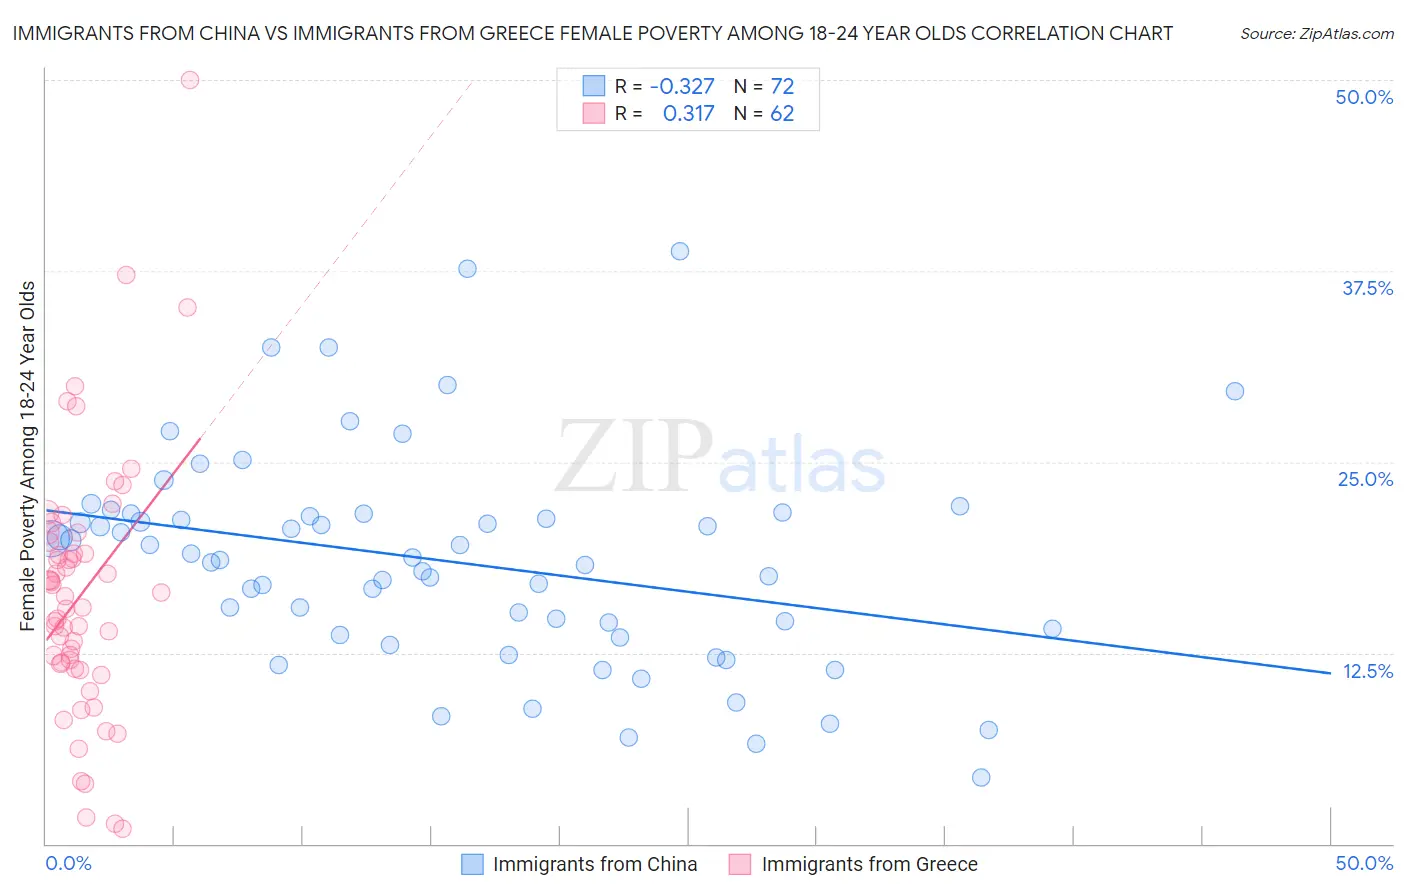
Immigrants from China vs Immigrants from Greece Female Poverty Among 18-24 Year Olds Correlation Chart
The statistical analysis conducted on geographies consisting of 442,287,819 people shows a mild negative correlation between the proportion of Immigrants from China and poverty level among females between the ages 18 and 24 in the United States with a correlation coefficient (R) of -0.327 and weighted average of 20.2%. Similarly, the statistical analysis conducted on geographies consisting of 212,433,308 people shows a mild positive correlation between the proportion of Immigrants from Greece and poverty level among females between the ages 18 and 24 in the United States with a correlation coefficient (R) of 0.317 and weighted average of 17.9%, a difference of 12.7%.
Female Poverty Among 18-24 Year Olds Correlation Summary
| Measurement | Immigrants from China | Immigrants from Greece |
| Minimum | 4.3% | 0.95% |
| Maximum | 38.8% | 50.0% |
| Range | 34.4% | 49.0% |
| Mean | 18.5% | 16.4% |
| Median | 18.6% | 15.8% |
| Interquartile 25% (IQ1) | 13.9% | 11.8% |
| Interquartile 75% (IQ3) | 21.5% | 19.8% |
| Interquartile Range (IQR) | 7.6% | 8.0% |
| Standard Deviation (Sample) | 6.9% | 8.6% |
| Standard Deviation (Population) | 6.9% | 8.5% |
Similar Demographics by Female Poverty Among 18-24 Year Olds
Demographics Similar to Immigrants from China by Female Poverty Among 18-24 Year Olds
In terms of female poverty among 18-24 year olds, the demographic groups most similar to Immigrants from China are Immigrants from Barbados (20.2%, a difference of 0.010%), Iraqi (20.2%, a difference of 0.020%), Ethiopian (20.2%, a difference of 0.040%), Swiss (20.2%, a difference of 0.050%), and Immigrants from Kazakhstan (20.2%, a difference of 0.060%).
| Demographics | Rating | Rank | Female Poverty Among 18-24 Year Olds |
| Swedes | 50.0 /100 | #174 | Average 20.1% |
| South American Indians | 48.4 /100 | #175 | Average 20.1% |
| Kenyans | 44.9 /100 | #176 | Average 20.2% |
| Immigrants | Kazakhstan | 44.2 /100 | #177 | Average 20.2% |
| Swiss | 44.0 /100 | #178 | Average 20.2% |
| Ethiopians | 43.8 /100 | #179 | Average 20.2% |
| Iraqis | 43.3 /100 | #180 | Average 20.2% |
| Immigrants | China | 43.0 /100 | #181 | Average 20.2% |
| Immigrants | Barbados | 42.8 /100 | #182 | Average 20.2% |
| Lebanese | 40.6 /100 | #183 | Average 20.2% |
| Immigrants | Central America | 39.9 /100 | #184 | Fair 20.2% |
| Nepalese | 39.7 /100 | #185 | Fair 20.2% |
| Immigrants | Ethiopia | 37.3 /100 | #186 | Fair 20.2% |
| Immigrants | Mexico | 36.3 /100 | #187 | Fair 20.2% |
| Scandinavians | 34.6 /100 | #188 | Fair 20.3% |
Demographics Similar to Immigrants from Greece by Female Poverty Among 18-24 Year Olds
In terms of female poverty among 18-24 year olds, the demographic groups most similar to Immigrants from Greece are Immigrants from Nicaragua (17.9%, a difference of 0.040%), Immigrants from South America (17.9%, a difference of 0.050%), Immigrants from Croatia (17.9%, a difference of 0.11%), Native Hawaiian (17.9%, a difference of 0.15%), and Immigrants from Moldova (17.9%, a difference of 0.18%).
| Demographics | Rating | Rank | Female Poverty Among 18-24 Year Olds |
| Venezuelans | 100.0 /100 | #28 | Exceptional 17.7% |
| Portuguese | 100.0 /100 | #29 | Exceptional 17.8% |
| Immigrants | South Eastern Asia | 100.0 /100 | #30 | Exceptional 17.8% |
| Immigrants | Vietnam | 100.0 /100 | #31 | Exceptional 17.8% |
| Immigrants | Moldova | 100.0 /100 | #32 | Exceptional 17.9% |
| Native Hawaiians | 100.0 /100 | #33 | Exceptional 17.9% |
| Immigrants | Nicaragua | 100.0 /100 | #34 | Exceptional 17.9% |
| Immigrants | Greece | 100.0 /100 | #35 | Exceptional 17.9% |
| Immigrants | South America | 100.0 /100 | #36 | Exceptional 17.9% |
| Immigrants | Croatia | 100.0 /100 | #37 | Exceptional 17.9% |
| South Americans | 100.0 /100 | #38 | Exceptional 18.0% |
| Puget Sound Salish | 100.0 /100 | #39 | Exceptional 18.0% |
| Immigrants | Romania | 100.0 /100 | #40 | Exceptional 18.0% |
| Immigrants | Argentina | 100.0 /100 | #41 | Exceptional 18.0% |
| Bulgarians | 100.0 /100 | #42 | Exceptional 18.1% |