Immigrants from Cambodia vs Australian Male Poverty
COMPARE
Immigrants from Cambodia
Australian
Male Poverty
Male Poverty Comparison
Immigrants from Cambodia
Australians
12.2%
MALE POVERTY
2.5/ 100
METRIC RATING
216th/ 347
METRIC RANK
10.4%
MALE POVERTY
94.4/ 100
METRIC RATING
93rd/ 347
METRIC RANK
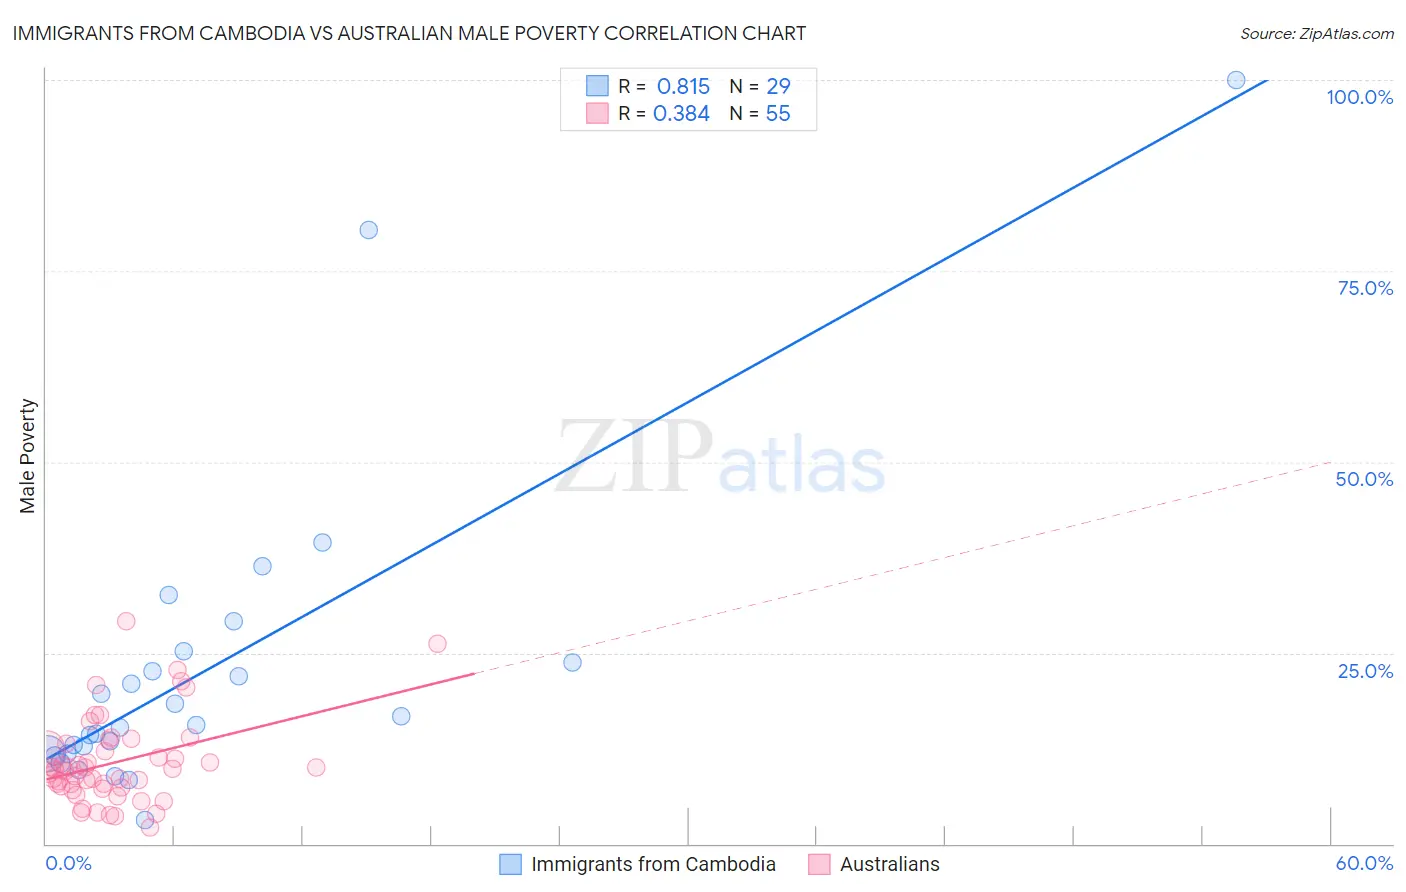
Immigrants from Cambodia vs Australian Male Poverty Correlation Chart
The statistical analysis conducted on geographies consisting of 205,120,472 people shows a very strong positive correlation between the proportion of Immigrants from Cambodia and poverty level among males in the United States with a correlation coefficient (R) of 0.815 and weighted average of 12.2%. Similarly, the statistical analysis conducted on geographies consisting of 223,991,142 people shows a mild positive correlation between the proportion of Australians and poverty level among males in the United States with a correlation coefficient (R) of 0.384 and weighted average of 10.4%, a difference of 17.1%.
Male Poverty Correlation Summary
| Measurement | Immigrants from Cambodia | Australian |
| Minimum | 3.1% | 2.1% |
| Maximum | 100.0% | 29.1% |
| Range | 96.9% | 27.0% |
| Mean | 22.8% | 10.7% |
| Median | 15.5% | 9.7% |
| Interquartile 25% (IQ1) | 11.8% | 7.3% |
| Interquartile 75% (IQ3) | 24.4% | 13.1% |
| Interquartile Range (IQR) | 12.7% | 5.9% |
| Standard Deviation (Sample) | 20.7% | 5.7% |
| Standard Deviation (Population) | 20.3% | 5.6% |
Similar Demographics by Male Poverty
Demographics Similar to Immigrants from Cambodia by Male Poverty
In terms of male poverty, the demographic groups most similar to Immigrants from Cambodia are Immigrants from Thailand (12.2%, a difference of 0.010%), German Russian (12.2%, a difference of 0.030%), Immigrants from Uzbekistan (12.2%, a difference of 0.080%), Bermudan (12.2%, a difference of 0.10%), and Immigrants from Eritrea (12.2%, a difference of 0.12%).
| Demographics | Rating | Rank | Male Poverty |
| Immigrants | Azores | 4.3 /100 | #209 | Tragic 12.0% |
| Moroccans | 4.2 /100 | #210 | Tragic 12.0% |
| Immigrants | Panama | 4.0 /100 | #211 | Tragic 12.1% |
| Americans | 3.2 /100 | #212 | Tragic 12.1% |
| Immigrants | Nonimmigrants | 3.1 /100 | #213 | Tragic 12.1% |
| Japanese | 2.7 /100 | #214 | Tragic 12.2% |
| Immigrants | Uzbekistan | 2.6 /100 | #215 | Tragic 12.2% |
| Immigrants | Cambodia | 2.5 /100 | #216 | Tragic 12.2% |
| Immigrants | Thailand | 2.5 /100 | #217 | Tragic 12.2% |
| German Russians | 2.5 /100 | #218 | Tragic 12.2% |
| Bermudans | 2.4 /100 | #219 | Tragic 12.2% |
| Immigrants | Eritrea | 2.4 /100 | #220 | Tragic 12.2% |
| Ugandans | 2.2 /100 | #221 | Tragic 12.2% |
| Immigrants | Africa | 2.1 /100 | #222 | Tragic 12.2% |
| Immigrants | Micronesia | 2.1 /100 | #223 | Tragic 12.2% |
Demographics Similar to Australians by Male Poverty
In terms of male poverty, the demographic groups most similar to Australians are Jordanian (10.4%, a difference of 0.0%), Immigrants from South Africa (10.4%, a difference of 0.17%), British (10.4%, a difference of 0.20%), Scottish (10.4%, a difference of 0.20%), and Indian (Asian) (10.4%, a difference of 0.27%).
| Demographics | Rating | Rank | Male Poverty |
| Immigrants | Eastern Asia | 95.3 /100 | #86 | Exceptional 10.4% |
| Northern Europeans | 95.2 /100 | #87 | Exceptional 10.4% |
| Cambodians | 95.0 /100 | #88 | Exceptional 10.4% |
| Immigrants | Denmark | 95.0 /100 | #89 | Exceptional 10.4% |
| Indians (Asian) | 94.9 /100 | #90 | Exceptional 10.4% |
| British | 94.8 /100 | #91 | Exceptional 10.4% |
| Jordanians | 94.4 /100 | #92 | Exceptional 10.4% |
| Australians | 94.4 /100 | #93 | Exceptional 10.4% |
| Immigrants | South Africa | 94.1 /100 | #94 | Exceptional 10.4% |
| Scottish | 94.0 /100 | #95 | Exceptional 10.4% |
| Immigrants | Egypt | 93.7 /100 | #96 | Exceptional 10.4% |
| Romanians | 93.6 /100 | #97 | Exceptional 10.5% |
| Finns | 93.4 /100 | #98 | Exceptional 10.5% |
| Immigrants | Indonesia | 93.3 /100 | #99 | Exceptional 10.5% |
| Immigrants | Latvia | 92.8 /100 | #100 | Exceptional 10.5% |