Immigrants from Cambodia vs Immigrants from Sri Lanka Male Poverty
COMPARE
Immigrants from Cambodia
Immigrants from Sri Lanka
Male Poverty
Male Poverty Comparison
Immigrants from Cambodia
Immigrants from Sri Lanka
12.2%
MALE POVERTY
2.5/ 100
METRIC RATING
216th/ 347
METRIC RANK
10.2%
MALE POVERTY
97.2/ 100
METRIC RATING
68th/ 347
METRIC RANK
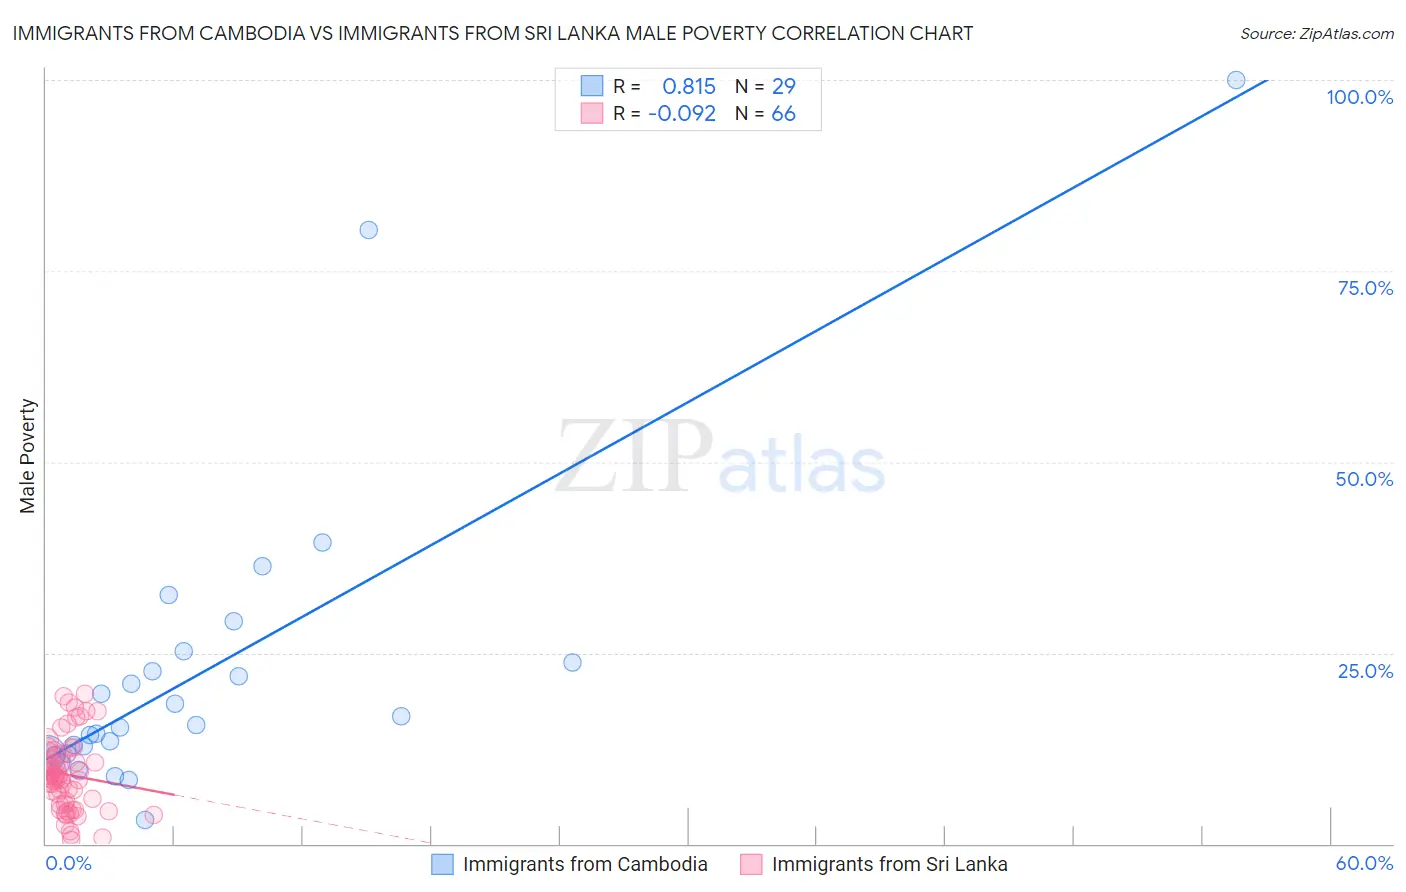
Immigrants from Cambodia vs Immigrants from Sri Lanka Male Poverty Correlation Chart
The statistical analysis conducted on geographies consisting of 205,120,472 people shows a very strong positive correlation between the proportion of Immigrants from Cambodia and poverty level among males in the United States with a correlation coefficient (R) of 0.815 and weighted average of 12.2%. Similarly, the statistical analysis conducted on geographies consisting of 149,670,593 people shows a slight negative correlation between the proportion of Immigrants from Sri Lanka and poverty level among males in the United States with a correlation coefficient (R) of -0.092 and weighted average of 10.2%, a difference of 19.4%.
Male Poverty Correlation Summary
| Measurement | Immigrants from Cambodia | Immigrants from Sri Lanka |
| Minimum | 3.1% | 0.43% |
| Maximum | 100.0% | 19.7% |
| Range | 96.9% | 19.3% |
| Mean | 22.8% | 9.0% |
| Median | 15.5% | 8.7% |
| Interquartile 25% (IQ1) | 11.8% | 5.2% |
| Interquartile 75% (IQ3) | 24.4% | 11.8% |
| Interquartile Range (IQR) | 12.7% | 6.6% |
| Standard Deviation (Sample) | 20.7% | 4.7% |
| Standard Deviation (Population) | 20.3% | 4.7% |
Similar Demographics by Male Poverty
Demographics Similar to Immigrants from Cambodia by Male Poverty
In terms of male poverty, the demographic groups most similar to Immigrants from Cambodia are Immigrants from Thailand (12.2%, a difference of 0.010%), German Russian (12.2%, a difference of 0.030%), Immigrants from Uzbekistan (12.2%, a difference of 0.080%), Bermudan (12.2%, a difference of 0.10%), and Immigrants from Eritrea (12.2%, a difference of 0.12%).
| Demographics | Rating | Rank | Male Poverty |
| Immigrants | Azores | 4.3 /100 | #209 | Tragic 12.0% |
| Moroccans | 4.2 /100 | #210 | Tragic 12.0% |
| Immigrants | Panama | 4.0 /100 | #211 | Tragic 12.1% |
| Americans | 3.2 /100 | #212 | Tragic 12.1% |
| Immigrants | Nonimmigrants | 3.1 /100 | #213 | Tragic 12.1% |
| Japanese | 2.7 /100 | #214 | Tragic 12.2% |
| Immigrants | Uzbekistan | 2.6 /100 | #215 | Tragic 12.2% |
| Immigrants | Cambodia | 2.5 /100 | #216 | Tragic 12.2% |
| Immigrants | Thailand | 2.5 /100 | #217 | Tragic 12.2% |
| German Russians | 2.5 /100 | #218 | Tragic 12.2% |
| Bermudans | 2.4 /100 | #219 | Tragic 12.2% |
| Immigrants | Eritrea | 2.4 /100 | #220 | Tragic 12.2% |
| Ugandans | 2.2 /100 | #221 | Tragic 12.2% |
| Immigrants | Africa | 2.1 /100 | #222 | Tragic 12.2% |
| Immigrants | Micronesia | 2.1 /100 | #223 | Tragic 12.2% |
Demographics Similar to Immigrants from Sri Lanka by Male Poverty
In terms of male poverty, the demographic groups most similar to Immigrants from Sri Lanka are Immigrants from Netherlands (10.2%, a difference of 0.050%), Immigrants from Australia (10.2%, a difference of 0.13%), Paraguayan (10.2%, a difference of 0.15%), European (10.2%, a difference of 0.18%), and Immigrants from Canada (10.2%, a difference of 0.18%).
| Demographics | Rating | Rank | Male Poverty |
| Austrians | 97.8 /100 | #61 | Exceptional 10.1% |
| Immigrants | Italy | 97.8 /100 | #62 | Exceptional 10.2% |
| Slovaks | 97.7 /100 | #63 | Exceptional 10.2% |
| Swiss | 97.5 /100 | #64 | Exceptional 10.2% |
| Zimbabweans | 97.5 /100 | #65 | Exceptional 10.2% |
| Serbians | 97.5 /100 | #66 | Exceptional 10.2% |
| Immigrants | Netherlands | 97.3 /100 | #67 | Exceptional 10.2% |
| Immigrants | Sri Lanka | 97.2 /100 | #68 | Exceptional 10.2% |
| Immigrants | Australia | 97.1 /100 | #69 | Exceptional 10.2% |
| Paraguayans | 97.1 /100 | #70 | Exceptional 10.2% |
| Europeans | 97.1 /100 | #71 | Exceptional 10.2% |
| Immigrants | Canada | 97.1 /100 | #72 | Exceptional 10.2% |
| Immigrants | Asia | 97.0 /100 | #73 | Exceptional 10.2% |
| Immigrants | Eastern Europe | 96.9 /100 | #74 | Exceptional 10.2% |
| Carpatho Rusyns | 96.9 /100 | #75 | Exceptional 10.2% |