Immigrants from Japan vs Australian Male Poverty
COMPARE
Immigrants from Japan
Australian
Male Poverty
Male Poverty Comparison
Immigrants from Japan
Australians
10.0%
MALE POVERTY
98.8/ 100
METRIC RATING
48th/ 347
METRIC RANK
10.4%
MALE POVERTY
94.4/ 100
METRIC RATING
93rd/ 347
METRIC RANK
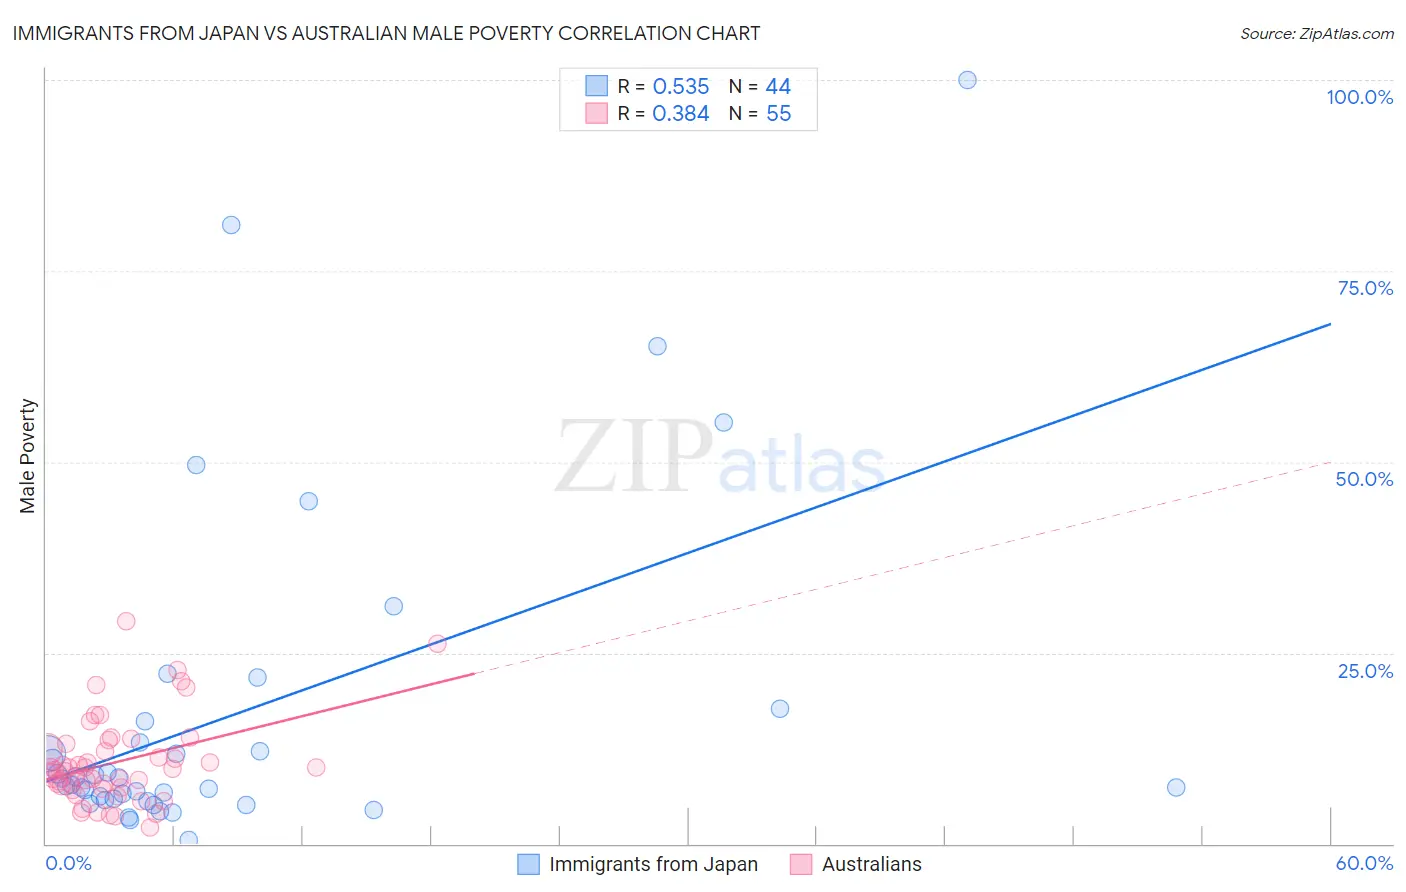
Immigrants from Japan vs Australian Male Poverty Correlation Chart
The statistical analysis conducted on geographies consisting of 339,942,398 people shows a substantial positive correlation between the proportion of Immigrants from Japan and poverty level among males in the United States with a correlation coefficient (R) of 0.535 and weighted average of 10.0%. Similarly, the statistical analysis conducted on geographies consisting of 223,991,142 people shows a mild positive correlation between the proportion of Australians and poverty level among males in the United States with a correlation coefficient (R) of 0.384 and weighted average of 10.4%, a difference of 4.4%.
Male Poverty Correlation Summary
| Measurement | Immigrants from Japan | Australian |
| Minimum | 0.45% | 2.1% |
| Maximum | 100.0% | 29.1% |
| Range | 99.6% | 27.0% |
| Mean | 16.8% | 10.7% |
| Median | 8.1% | 9.7% |
| Interquartile 25% (IQ1) | 5.8% | 7.3% |
| Interquartile 75% (IQ3) | 14.6% | 13.1% |
| Interquartile Range (IQR) | 8.8% | 5.9% |
| Standard Deviation (Sample) | 21.7% | 5.7% |
| Standard Deviation (Population) | 21.5% | 5.6% |
Similar Demographics by Male Poverty
Demographics Similar to Immigrants from Japan by Male Poverty
In terms of male poverty, the demographic groups most similar to Immigrants from Japan are Immigrants from Singapore (10.0%, a difference of 0.0%), Slovene (10.0%, a difference of 0.090%), Turkish (10.0%, a difference of 0.13%), Immigrants from Philippines (10.0%, a difference of 0.14%), and Immigrants from Serbia (10.0%, a difference of 0.15%).
| Demographics | Rating | Rank | Male Poverty |
| Koreans | 99.2 /100 | #41 | Exceptional 9.9% |
| Immigrants | Iran | 99.1 /100 | #42 | Exceptional 9.9% |
| Immigrants | Moldova | 99.0 /100 | #43 | Exceptional 9.9% |
| Immigrants | Romania | 98.9 /100 | #44 | Exceptional 9.9% |
| Immigrants | Serbia | 98.9 /100 | #45 | Exceptional 10.0% |
| Turks | 98.9 /100 | #46 | Exceptional 10.0% |
| Immigrants | Singapore | 98.8 /100 | #47 | Exceptional 10.0% |
| Immigrants | Japan | 98.8 /100 | #48 | Exceptional 10.0% |
| Slovenes | 98.8 /100 | #49 | Exceptional 10.0% |
| Immigrants | Philippines | 98.7 /100 | #50 | Exceptional 10.0% |
| Immigrants | Croatia | 98.7 /100 | #51 | Exceptional 10.0% |
| Asians | 98.7 /100 | #52 | Exceptional 10.0% |
| Immigrants | Czechoslovakia | 98.6 /100 | #53 | Exceptional 10.0% |
| Immigrants | Austria | 98.5 /100 | #54 | Exceptional 10.0% |
| Germans | 98.3 /100 | #55 | Exceptional 10.1% |
Demographics Similar to Australians by Male Poverty
In terms of male poverty, the demographic groups most similar to Australians are Jordanian (10.4%, a difference of 0.0%), Immigrants from South Africa (10.4%, a difference of 0.17%), British (10.4%, a difference of 0.20%), Scottish (10.4%, a difference of 0.20%), and Indian (Asian) (10.4%, a difference of 0.27%).
| Demographics | Rating | Rank | Male Poverty |
| Immigrants | Eastern Asia | 95.3 /100 | #86 | Exceptional 10.4% |
| Northern Europeans | 95.2 /100 | #87 | Exceptional 10.4% |
| Cambodians | 95.0 /100 | #88 | Exceptional 10.4% |
| Immigrants | Denmark | 95.0 /100 | #89 | Exceptional 10.4% |
| Indians (Asian) | 94.9 /100 | #90 | Exceptional 10.4% |
| British | 94.8 /100 | #91 | Exceptional 10.4% |
| Jordanians | 94.4 /100 | #92 | Exceptional 10.4% |
| Australians | 94.4 /100 | #93 | Exceptional 10.4% |
| Immigrants | South Africa | 94.1 /100 | #94 | Exceptional 10.4% |
| Scottish | 94.0 /100 | #95 | Exceptional 10.4% |
| Immigrants | Egypt | 93.7 /100 | #96 | Exceptional 10.4% |
| Romanians | 93.6 /100 | #97 | Exceptional 10.5% |
| Finns | 93.4 /100 | #98 | Exceptional 10.5% |
| Immigrants | Indonesia | 93.3 /100 | #99 | Exceptional 10.5% |
| Immigrants | Latvia | 92.8 /100 | #100 | Exceptional 10.5% |