Immigrants from Cambodia vs Jamaican Male Poverty
COMPARE
Immigrants from Cambodia
Jamaican
Male Poverty
Male Poverty Comparison
Immigrants from Cambodia
Jamaicans
12.2%
MALE POVERTY
2.5/ 100
METRIC RATING
216th/ 347
METRIC RANK
13.2%
MALE POVERTY
0.1/ 100
METRIC RATING
265th/ 347
METRIC RANK
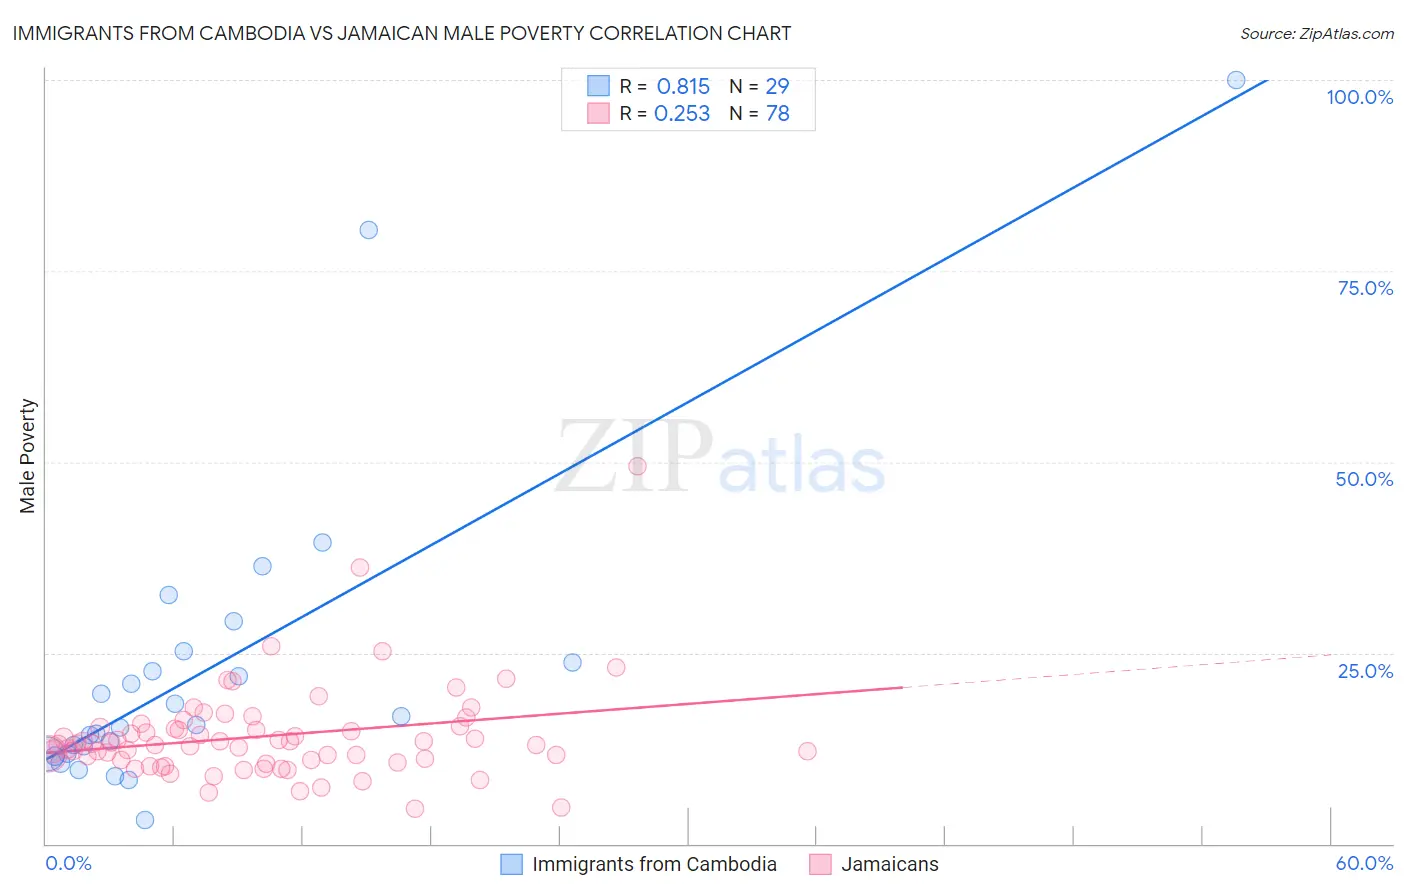
Immigrants from Cambodia vs Jamaican Male Poverty Correlation Chart
The statistical analysis conducted on geographies consisting of 205,120,472 people shows a very strong positive correlation between the proportion of Immigrants from Cambodia and poverty level among males in the United States with a correlation coefficient (R) of 0.815 and weighted average of 12.2%. Similarly, the statistical analysis conducted on geographies consisting of 367,625,725 people shows a weak positive correlation between the proportion of Jamaicans and poverty level among males in the United States with a correlation coefficient (R) of 0.253 and weighted average of 13.2%, a difference of 8.4%.
Male Poverty Correlation Summary
| Measurement | Immigrants from Cambodia | Jamaican |
| Minimum | 3.1% | 4.6% |
| Maximum | 100.0% | 49.4% |
| Range | 96.9% | 44.8% |
| Mean | 22.8% | 14.1% |
| Median | 15.5% | 13.0% |
| Interquartile 25% (IQ1) | 11.8% | 11.0% |
| Interquartile 75% (IQ3) | 24.4% | 15.2% |
| Interquartile Range (IQR) | 12.7% | 4.2% |
| Standard Deviation (Sample) | 20.7% | 6.3% |
| Standard Deviation (Population) | 20.3% | 6.3% |
Similar Demographics by Male Poverty
Demographics Similar to Immigrants from Cambodia by Male Poverty
In terms of male poverty, the demographic groups most similar to Immigrants from Cambodia are Immigrants from Thailand (12.2%, a difference of 0.010%), German Russian (12.2%, a difference of 0.030%), Immigrants from Uzbekistan (12.2%, a difference of 0.080%), Bermudan (12.2%, a difference of 0.10%), and Immigrants from Eritrea (12.2%, a difference of 0.12%).
| Demographics | Rating | Rank | Male Poverty |
| Immigrants | Azores | 4.3 /100 | #209 | Tragic 12.0% |
| Moroccans | 4.2 /100 | #210 | Tragic 12.0% |
| Immigrants | Panama | 4.0 /100 | #211 | Tragic 12.1% |
| Americans | 3.2 /100 | #212 | Tragic 12.1% |
| Immigrants | Nonimmigrants | 3.1 /100 | #213 | Tragic 12.1% |
| Japanese | 2.7 /100 | #214 | Tragic 12.2% |
| Immigrants | Uzbekistan | 2.6 /100 | #215 | Tragic 12.2% |
| Immigrants | Cambodia | 2.5 /100 | #216 | Tragic 12.2% |
| Immigrants | Thailand | 2.5 /100 | #217 | Tragic 12.2% |
| German Russians | 2.5 /100 | #218 | Tragic 12.2% |
| Bermudans | 2.4 /100 | #219 | Tragic 12.2% |
| Immigrants | Eritrea | 2.4 /100 | #220 | Tragic 12.2% |
| Ugandans | 2.2 /100 | #221 | Tragic 12.2% |
| Immigrants | Africa | 2.1 /100 | #222 | Tragic 12.2% |
| Immigrants | Micronesia | 2.1 /100 | #223 | Tragic 12.2% |
Demographics Similar to Jamaicans by Male Poverty
In terms of male poverty, the demographic groups most similar to Jamaicans are Iroquois (13.2%, a difference of 0.020%), Immigrants from Guyana (13.2%, a difference of 0.14%), Immigrants from Jamaica (13.3%, a difference of 0.26%), Subsaharan African (13.3%, a difference of 0.28%), and Central American (13.2%, a difference of 0.38%).
| Demographics | Rating | Rank | Male Poverty |
| Cape Verdeans | 0.1 /100 | #258 | Tragic 13.1% |
| Cherokee | 0.1 /100 | #259 | Tragic 13.1% |
| Ottawa | 0.1 /100 | #260 | Tragic 13.1% |
| Trinidadians and Tobagonians | 0.1 /100 | #261 | Tragic 13.1% |
| Spanish American Indians | 0.1 /100 | #262 | Tragic 13.1% |
| Central Americans | 0.1 /100 | #263 | Tragic 13.2% |
| Iroquois | 0.1 /100 | #264 | Tragic 13.2% |
| Jamaicans | 0.1 /100 | #265 | Tragic 13.2% |
| Immigrants | Guyana | 0.1 /100 | #266 | Tragic 13.2% |
| Immigrants | Jamaica | 0.1 /100 | #267 | Tragic 13.3% |
| Sub-Saharan Africans | 0.1 /100 | #268 | Tragic 13.3% |
| Guyanese | 0.0 /100 | #269 | Tragic 13.3% |
| Cree | 0.0 /100 | #270 | Tragic 13.3% |
| Spanish Americans | 0.0 /100 | #271 | Tragic 13.4% |
| Immigrants | Bahamas | 0.0 /100 | #272 | Tragic 13.5% |