Immigrants from Cambodia vs Houma Male Poverty
COMPARE
Immigrants from Cambodia
Houma
Male Poverty
Male Poverty Comparison
Immigrants from Cambodia
Houma
12.2%
MALE POVERTY
2.5/ 100
METRIC RATING
216th/ 347
METRIC RANK
16.7%
MALE POVERTY
0.0/ 100
METRIC RATING
332nd/ 347
METRIC RANK
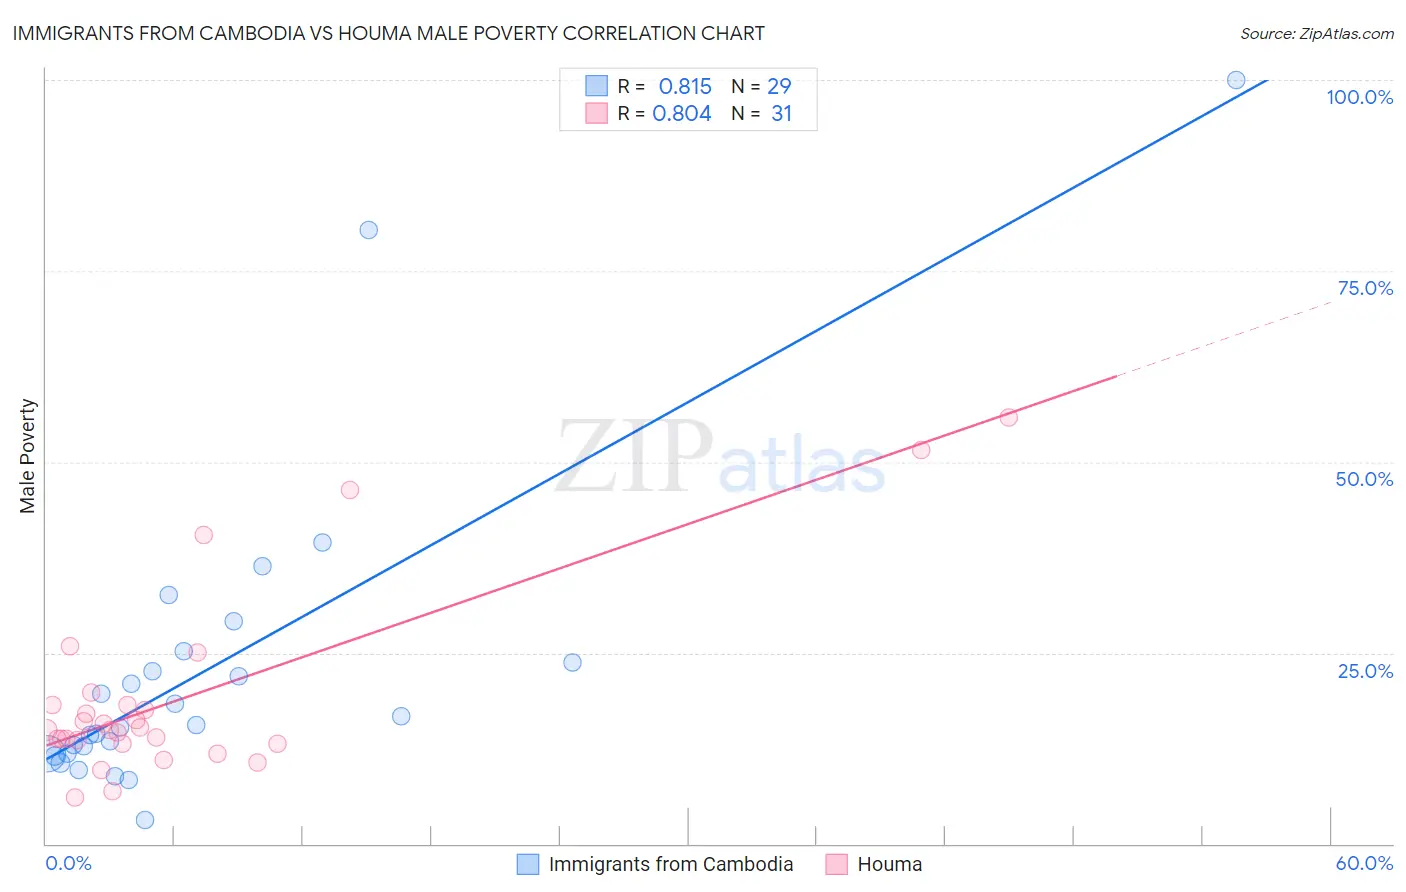
Immigrants from Cambodia vs Houma Male Poverty Correlation Chart
The statistical analysis conducted on geographies consisting of 205,120,472 people shows a very strong positive correlation between the proportion of Immigrants from Cambodia and poverty level among males in the United States with a correlation coefficient (R) of 0.815 and weighted average of 12.2%. Similarly, the statistical analysis conducted on geographies consisting of 36,790,464 people shows a very strong positive correlation between the proportion of Houma and poverty level among males in the United States with a correlation coefficient (R) of 0.804 and weighted average of 16.7%, a difference of 37.1%.
Male Poverty Correlation Summary
| Measurement | Immigrants from Cambodia | Houma |
| Minimum | 3.1% | 6.0% |
| Maximum | 100.0% | 55.7% |
| Range | 96.9% | 49.7% |
| Mean | 22.8% | 19.1% |
| Median | 15.5% | 14.9% |
| Interquartile 25% (IQ1) | 11.8% | 13.1% |
| Interquartile 75% (IQ3) | 24.4% | 18.1% |
| Interquartile Range (IQR) | 12.7% | 5.1% |
| Standard Deviation (Sample) | 20.7% | 12.4% |
| Standard Deviation (Population) | 20.3% | 12.2% |
Similar Demographics by Male Poverty
Demographics Similar to Immigrants from Cambodia by Male Poverty
In terms of male poverty, the demographic groups most similar to Immigrants from Cambodia are Immigrants from Thailand (12.2%, a difference of 0.010%), German Russian (12.2%, a difference of 0.030%), Immigrants from Uzbekistan (12.2%, a difference of 0.080%), Bermudan (12.2%, a difference of 0.10%), and Immigrants from Eritrea (12.2%, a difference of 0.12%).
| Demographics | Rating | Rank | Male Poverty |
| Immigrants | Azores | 4.3 /100 | #209 | Tragic 12.0% |
| Moroccans | 4.2 /100 | #210 | Tragic 12.0% |
| Immigrants | Panama | 4.0 /100 | #211 | Tragic 12.1% |
| Americans | 3.2 /100 | #212 | Tragic 12.1% |
| Immigrants | Nonimmigrants | 3.1 /100 | #213 | Tragic 12.1% |
| Japanese | 2.7 /100 | #214 | Tragic 12.2% |
| Immigrants | Uzbekistan | 2.6 /100 | #215 | Tragic 12.2% |
| Immigrants | Cambodia | 2.5 /100 | #216 | Tragic 12.2% |
| Immigrants | Thailand | 2.5 /100 | #217 | Tragic 12.2% |
| German Russians | 2.5 /100 | #218 | Tragic 12.2% |
| Bermudans | 2.4 /100 | #219 | Tragic 12.2% |
| Immigrants | Eritrea | 2.4 /100 | #220 | Tragic 12.2% |
| Ugandans | 2.2 /100 | #221 | Tragic 12.2% |
| Immigrants | Africa | 2.1 /100 | #222 | Tragic 12.2% |
| Immigrants | Micronesia | 2.1 /100 | #223 | Tragic 12.2% |
Demographics Similar to Houma by Male Poverty
In terms of male poverty, the demographic groups most similar to Houma are Native/Alaskan (16.9%, a difference of 1.2%), Ute (16.2%, a difference of 3.0%), Immigrants from Dominican Republic (16.2%, a difference of 3.3%), Dominican (16.1%, a difference of 4.0%), and Cheyenne (17.6%, a difference of 5.4%).
| Demographics | Rating | Rank | Male Poverty |
| Yakama | 0.0 /100 | #325 | Tragic 15.3% |
| Central American Indians | 0.0 /100 | #326 | Tragic 15.3% |
| Paiute | 0.0 /100 | #327 | Tragic 15.8% |
| Blacks/African Americans | 0.0 /100 | #328 | Tragic 15.8% |
| Dominicans | 0.0 /100 | #329 | Tragic 16.1% |
| Immigrants | Dominican Republic | 0.0 /100 | #330 | Tragic 16.2% |
| Ute | 0.0 /100 | #331 | Tragic 16.2% |
| Houma | 0.0 /100 | #332 | Tragic 16.7% |
| Natives/Alaskans | 0.0 /100 | #333 | Tragic 16.9% |
| Cheyenne | 0.0 /100 | #334 | Tragic 17.6% |
| Apache | 0.0 /100 | #335 | Tragic 17.7% |
| Pueblo | 0.0 /100 | #336 | Tragic 18.5% |
| Sioux | 0.0 /100 | #337 | Tragic 18.7% |
| Crow | 0.0 /100 | #338 | Tragic 19.1% |
| Yuman | 0.0 /100 | #339 | Tragic 19.5% |