Immigrants from Cambodia vs Immigrants from Laos Male Poverty
COMPARE
Immigrants from Cambodia
Immigrants from Laos
Male Poverty
Male Poverty Comparison
Immigrants from Cambodia
Immigrants from Laos
12.2%
MALE POVERTY
2.5/ 100
METRIC RATING
216th/ 347
METRIC RANK
12.6%
MALE POVERTY
0.5/ 100
METRIC RATING
235th/ 347
METRIC RANK
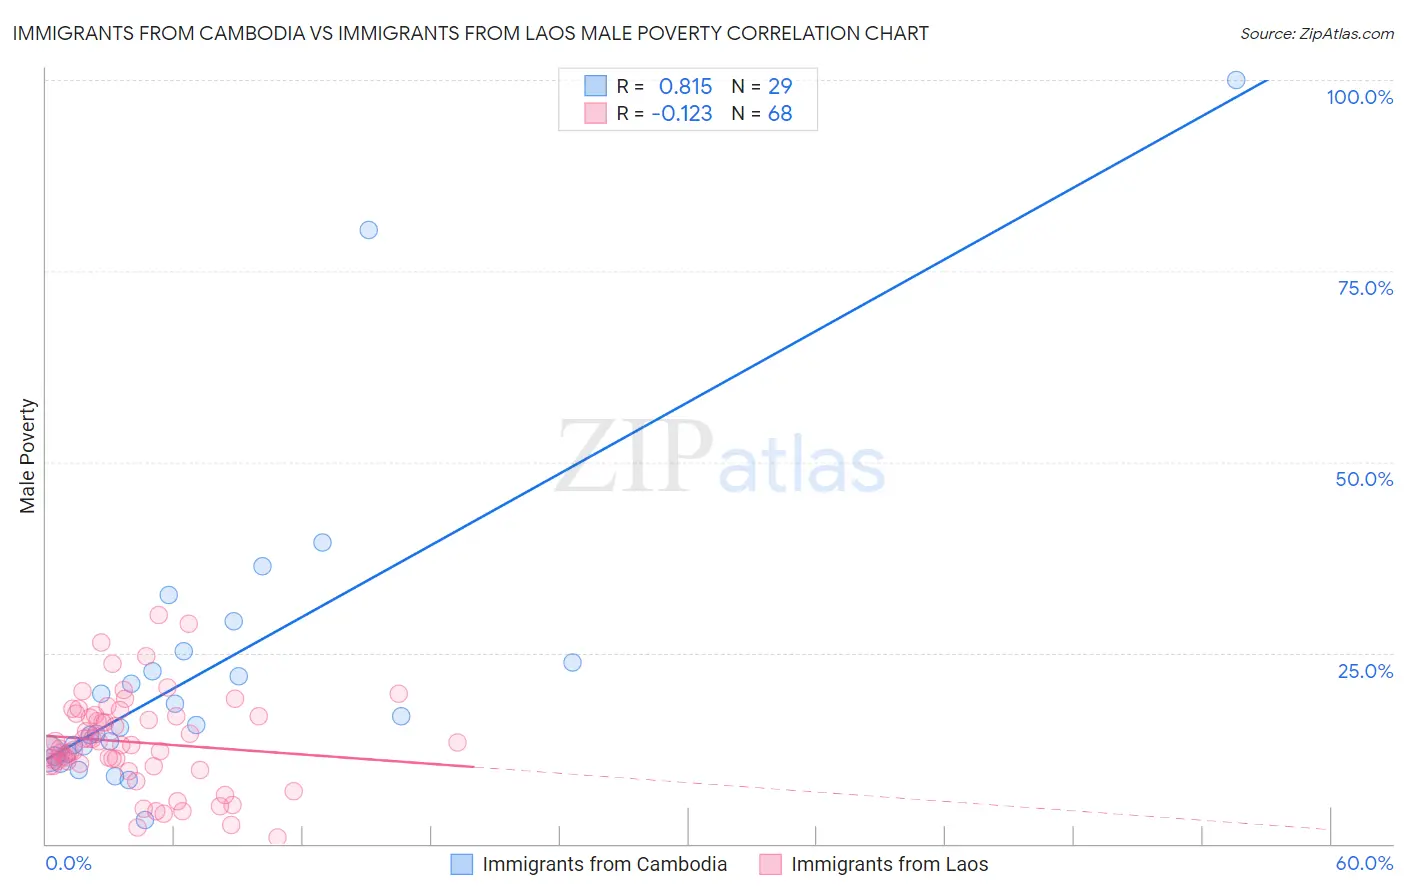
Immigrants from Cambodia vs Immigrants from Laos Male Poverty Correlation Chart
The statistical analysis conducted on geographies consisting of 205,120,472 people shows a very strong positive correlation between the proportion of Immigrants from Cambodia and poverty level among males in the United States with a correlation coefficient (R) of 0.815 and weighted average of 12.2%. Similarly, the statistical analysis conducted on geographies consisting of 201,450,990 people shows a poor negative correlation between the proportion of Immigrants from Laos and poverty level among males in the United States with a correlation coefficient (R) of -0.123 and weighted average of 12.6%, a difference of 3.7%.
Male Poverty Correlation Summary
| Measurement | Immigrants from Cambodia | Immigrants from Laos |
| Minimum | 3.1% | 0.78% |
| Maximum | 100.0% | 29.9% |
| Range | 96.9% | 29.2% |
| Mean | 22.8% | 13.3% |
| Median | 15.5% | 12.9% |
| Interquartile 25% (IQ1) | 11.8% | 10.3% |
| Interquartile 75% (IQ3) | 24.4% | 16.8% |
| Interquartile Range (IQR) | 12.7% | 6.4% |
| Standard Deviation (Sample) | 20.7% | 6.1% |
| Standard Deviation (Population) | 20.3% | 6.1% |
Demographics Similar to Immigrants from Cambodia and Immigrants from Laos by Male Poverty
In terms of male poverty, the demographic groups most similar to Immigrants from Cambodia are Immigrants from Thailand (12.2%, a difference of 0.010%), German Russian (12.2%, a difference of 0.030%), Immigrants from Uzbekistan (12.2%, a difference of 0.080%), Bermudan (12.2%, a difference of 0.10%), and Immigrants from Eritrea (12.2%, a difference of 0.12%). Similarly, the demographic groups most similar to Immigrants from Laos are Immigrants from Armenia (12.6%, a difference of 0.36%), Fijian (12.6%, a difference of 0.43%), Nicaraguan (12.6%, a difference of 0.47%), Salvadoran (12.6%, a difference of 0.59%), and Marshallese (12.5%, a difference of 1.1%).
| Demographics | Rating | Rank | Male Poverty |
| Immigrants | Uzbekistan | 2.6 /100 | #215 | Tragic 12.2% |
| Immigrants | Cambodia | 2.5 /100 | #216 | Tragic 12.2% |
| Immigrants | Thailand | 2.5 /100 | #217 | Tragic 12.2% |
| German Russians | 2.5 /100 | #218 | Tragic 12.2% |
| Bermudans | 2.4 /100 | #219 | Tragic 12.2% |
| Immigrants | Eritrea | 2.4 /100 | #220 | Tragic 12.2% |
| Ugandans | 2.2 /100 | #221 | Tragic 12.2% |
| Immigrants | Africa | 2.1 /100 | #222 | Tragic 12.2% |
| Immigrants | Micronesia | 2.1 /100 | #223 | Tragic 12.2% |
| Immigrants | Nigeria | 1.6 /100 | #224 | Tragic 12.3% |
| Osage | 1.5 /100 | #225 | Tragic 12.3% |
| Nigerians | 1.4 /100 | #226 | Tragic 12.3% |
| Alaska Natives | 1.4 /100 | #227 | Tragic 12.4% |
| Alsatians | 1.3 /100 | #228 | Tragic 12.4% |
| Cubans | 1.3 /100 | #229 | Tragic 12.4% |
| Marshallese | 0.8 /100 | #230 | Tragic 12.5% |
| Salvadorans | 0.6 /100 | #231 | Tragic 12.6% |
| Nicaraguans | 0.6 /100 | #232 | Tragic 12.6% |
| Fijians | 0.6 /100 | #233 | Tragic 12.6% |
| Immigrants | Armenia | 0.6 /100 | #234 | Tragic 12.6% |
| Immigrants | Laos | 0.5 /100 | #235 | Tragic 12.6% |