Immigrants from Cabo Verde vs Immigrants from Morocco Disability Age Over 75
COMPARE
Immigrants from Cabo Verde
Immigrants from Morocco
Disability Age Over 75
Disability Age Over 75 Comparison
Immigrants from Cabo Verde
Immigrants from Morocco
52.4%
DISABILITY AGE OVER 75
0.0/ 100
METRIC RATING
325th/ 347
METRIC RANK
47.1%
DISABILITY AGE OVER 75
71.4/ 100
METRIC RATING
159th/ 347
METRIC RANK
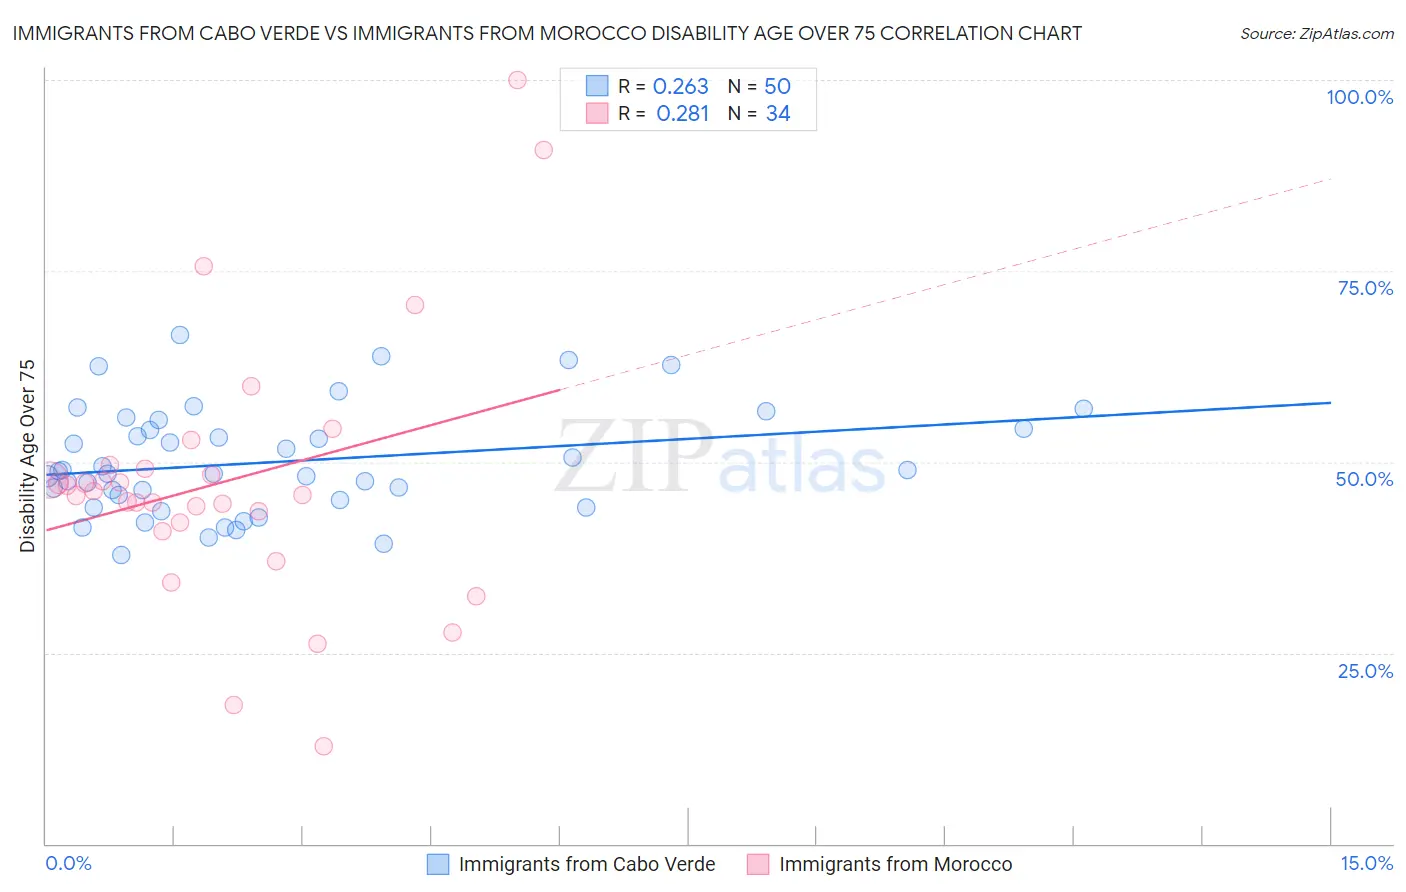
Immigrants from Cabo Verde vs Immigrants from Morocco Disability Age Over 75 Correlation Chart
The statistical analysis conducted on geographies consisting of 38,123,321 people shows a weak positive correlation between the proportion of Immigrants from Cabo Verde and percentage of population with a disability over the age of 75 in the United States with a correlation coefficient (R) of 0.263 and weighted average of 52.4%. Similarly, the statistical analysis conducted on geographies consisting of 178,881,213 people shows a weak positive correlation between the proportion of Immigrants from Morocco and percentage of population with a disability over the age of 75 in the United States with a correlation coefficient (R) of 0.281 and weighted average of 47.1%, a difference of 11.2%.
Disability Age Over 75 Correlation Summary
| Measurement | Immigrants from Cabo Verde | Immigrants from Morocco |
| Minimum | 37.9% | 12.8% |
| Maximum | 66.6% | 100.0% |
| Range | 28.7% | 87.2% |
| Mean | 50.0% | 47.3% |
| Median | 48.6% | 45.9% |
| Interquartile 25% (IQ1) | 45.1% | 42.1% |
| Interquartile 75% (IQ3) | 54.4% | 49.1% |
| Interquartile Range (IQR) | 9.3% | 7.0% |
| Standard Deviation (Sample) | 7.0% | 17.2% |
| Standard Deviation (Population) | 6.9% | 17.0% |
Similar Demographics by Disability Age Over 75
Demographics Similar to Immigrants from Cabo Verde by Disability Age Over 75
In terms of disability age over 75, the demographic groups most similar to Immigrants from Cabo Verde are Menominee (52.3%, a difference of 0.16%), Ute (52.6%, a difference of 0.35%), Nepalese (52.6%, a difference of 0.38%), Choctaw (52.7%, a difference of 0.57%), and Alaska Native (52.8%, a difference of 0.78%).
| Demographics | Rating | Rank | Disability Age Over 75 |
| Seminole | 0.0 /100 | #318 | Tragic 51.5% |
| Creek | 0.0 /100 | #319 | Tragic 51.5% |
| Paiute | 0.0 /100 | #320 | Tragic 51.5% |
| Dutch West Indians | 0.0 /100 | #321 | Tragic 51.5% |
| Comanche | 0.0 /100 | #322 | Tragic 51.7% |
| Immigrants | Yemen | 0.0 /100 | #323 | Tragic 52.0% |
| Menominee | 0.0 /100 | #324 | Tragic 52.3% |
| Immigrants | Cabo Verde | 0.0 /100 | #325 | Tragic 52.4% |
| Ute | 0.0 /100 | #326 | Tragic 52.6% |
| Nepalese | 0.0 /100 | #327 | Tragic 52.6% |
| Choctaw | 0.0 /100 | #328 | Tragic 52.7% |
| Alaska Natives | 0.0 /100 | #329 | Tragic 52.8% |
| Puerto Ricans | 0.0 /100 | #330 | Tragic 52.9% |
| Hopi | 0.0 /100 | #331 | Tragic 52.9% |
| Natives/Alaskans | 0.0 /100 | #332 | Tragic 53.1% |
Demographics Similar to Immigrants from Morocco by Disability Age Over 75
In terms of disability age over 75, the demographic groups most similar to Immigrants from Morocco are Immigrants from Guyana (47.1%, a difference of 0.010%), Bhutanese (47.1%, a difference of 0.030%), Arab (47.1%, a difference of 0.050%), Immigrants from Middle Africa (47.1%, a difference of 0.080%), and Immigrants from Iran (47.1%, a difference of 0.090%).
| Demographics | Rating | Rank | Disability Age Over 75 |
| Immigrants | Asia | 76.5 /100 | #152 | Good 47.0% |
| Immigrants | Zaire | 74.8 /100 | #153 | Good 47.1% |
| Immigrants | Belarus | 74.8 /100 | #154 | Good 47.1% |
| Immigrants | Iran | 74.7 /100 | #155 | Good 47.1% |
| Arabs | 73.3 /100 | #156 | Good 47.1% |
| Bhutanese | 72.6 /100 | #157 | Good 47.1% |
| Immigrants | Guyana | 71.9 /100 | #158 | Good 47.1% |
| Immigrants | Morocco | 71.4 /100 | #159 | Good 47.1% |
| Immigrants | Middle Africa | 68.3 /100 | #160 | Good 47.1% |
| South American Indians | 68.1 /100 | #161 | Good 47.1% |
| Pennsylvania Germans | 66.0 /100 | #162 | Good 47.2% |
| Immigrants | Eastern Africa | 65.5 /100 | #163 | Good 47.2% |
| French | 64.6 /100 | #164 | Good 47.2% |
| Immigrants | Zimbabwe | 64.4 /100 | #165 | Good 47.2% |
| Immigrants | Sierra Leone | 64.4 /100 | #166 | Good 47.2% |