Guatemalan vs Immigrants from Morocco Receiving Food Stamps
COMPARE
Guatemalan
Immigrants from Morocco
Receiving Food Stamps
Receiving Food Stamps Comparison
Guatemalans
Immigrants from Morocco
14.4%
RECEIVING FOOD STAMPS
0.1/ 100
METRIC RATING
268th/ 347
METRIC RANK
11.9%
RECEIVING FOOD STAMPS
40.7/ 100
METRIC RATING
182nd/ 347
METRIC RANK
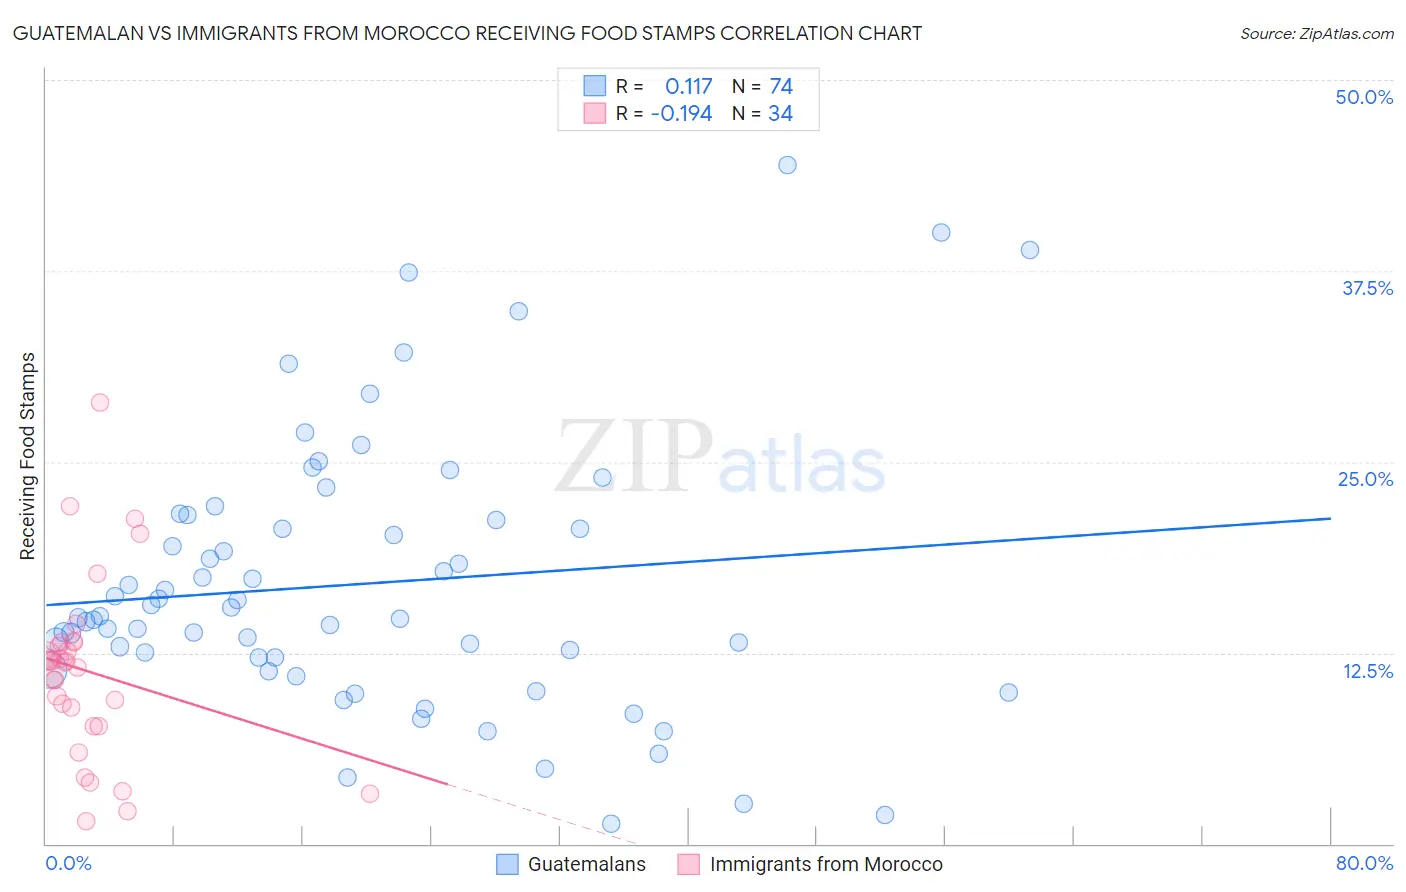
Guatemalan vs Immigrants from Morocco Receiving Food Stamps Correlation Chart
The statistical analysis conducted on geographies consisting of 408,642,708 people shows a poor positive correlation between the proportion of Guatemalans and percentage of population receiving government assistance and/or food stamps in the United States with a correlation coefficient (R) of 0.117 and weighted average of 14.4%. Similarly, the statistical analysis conducted on geographies consisting of 178,818,675 people shows a poor negative correlation between the proportion of Immigrants from Morocco and percentage of population receiving government assistance and/or food stamps in the United States with a correlation coefficient (R) of -0.194 and weighted average of 11.9%, a difference of 21.2%.
Receiving Food Stamps Correlation Summary
| Measurement | Guatemalan | Immigrants from Morocco |
| Minimum | 1.3% | 1.5% |
| Maximum | 44.4% | 28.9% |
| Range | 43.1% | 27.4% |
| Mean | 17.0% | 11.3% |
| Median | 14.8% | 11.9% |
| Interquartile 25% (IQ1) | 12.2% | 7.7% |
| Interquartile 75% (IQ3) | 21.2% | 13.1% |
| Interquartile Range (IQR) | 9.0% | 5.4% |
| Standard Deviation (Sample) | 8.9% | 5.9% |
| Standard Deviation (Population) | 8.8% | 5.8% |
Similar Demographics by Receiving Food Stamps
Demographics Similar to Guatemalans by Receiving Food Stamps
In terms of receiving food stamps, the demographic groups most similar to Guatemalans are Dutch West Indian (14.3%, a difference of 0.66%), Cheyenne (14.3%, a difference of 0.88%), Blackfeet (14.3%, a difference of 0.96%), Immigrants from Uzbekistan (14.3%, a difference of 1.0%), and Paiute (14.3%, a difference of 1.1%).
| Demographics | Rating | Rank | Receiving Food Stamps |
| Immigrants | Congo | 0.3 /100 | #261 | Tragic 14.1% |
| Paiute | 0.2 /100 | #262 | Tragic 14.3% |
| Immigrants | Portugal | 0.2 /100 | #263 | Tragic 14.3% |
| Immigrants | Uzbekistan | 0.2 /100 | #264 | Tragic 14.3% |
| Blackfeet | 0.2 /100 | #265 | Tragic 14.3% |
| Cheyenne | 0.2 /100 | #266 | Tragic 14.3% |
| Dutch West Indians | 0.2 /100 | #267 | Tragic 14.3% |
| Guatemalans | 0.1 /100 | #268 | Tragic 14.4% |
| Nepalese | 0.1 /100 | #269 | Tragic 14.6% |
| Mexicans | 0.1 /100 | #270 | Tragic 14.6% |
| Immigrants | Guatemala | 0.1 /100 | #271 | Tragic 14.6% |
| Chippewa | 0.1 /100 | #272 | Tragic 14.7% |
| Alaskan Athabascans | 0.1 /100 | #273 | Tragic 14.7% |
| Immigrants | Western Africa | 0.1 /100 | #274 | Tragic 14.7% |
| Ute | 0.1 /100 | #275 | Tragic 14.7% |
Demographics Similar to Immigrants from Morocco by Receiving Food Stamps
In terms of receiving food stamps, the demographic groups most similar to Immigrants from Morocco are Immigrants from Uganda (11.9%, a difference of 0.060%), Spaniard (11.9%, a difference of 0.13%), South American Indian (11.9%, a difference of 0.15%), Immigrants from Iraq (12.0%, a difference of 0.52%), and Spanish (12.0%, a difference of 0.56%).
| Demographics | Rating | Rank | Receiving Food Stamps |
| Osage | 49.8 /100 | #175 | Average 11.7% |
| Peruvians | 49.3 /100 | #176 | Average 11.7% |
| Immigrants | Ukraine | 48.4 /100 | #177 | Average 11.8% |
| German Russians | 48.1 /100 | #178 | Average 11.8% |
| Immigrants | Kenya | 46.4 /100 | #179 | Average 11.8% |
| Uruguayans | 44.8 /100 | #180 | Average 11.8% |
| South American Indians | 41.7 /100 | #181 | Average 11.9% |
| Immigrants | Morocco | 40.7 /100 | #182 | Average 11.9% |
| Immigrants | Uganda | 40.3 /100 | #183 | Average 11.9% |
| Spaniards | 39.8 /100 | #184 | Fair 11.9% |
| Immigrants | Iraq | 37.1 /100 | #185 | Fair 12.0% |
| Spanish | 36.9 /100 | #186 | Fair 12.0% |
| Albanians | 35.4 /100 | #187 | Fair 12.0% |
| Sudanese | 33.4 /100 | #188 | Fair 12.0% |
| Immigrants | Cameroon | 32.5 /100 | #189 | Fair 12.0% |