Nigerian vs Immigrants from Morocco Receiving Food Stamps
COMPARE
Nigerian
Immigrants from Morocco
Receiving Food Stamps
Receiving Food Stamps Comparison
Nigerians
Immigrants from Morocco
13.1%
RECEIVING FOOD STAMPS
3.5/ 100
METRIC RATING
227th/ 347
METRIC RANK
11.9%
RECEIVING FOOD STAMPS
40.7/ 100
METRIC RATING
182nd/ 347
METRIC RANK
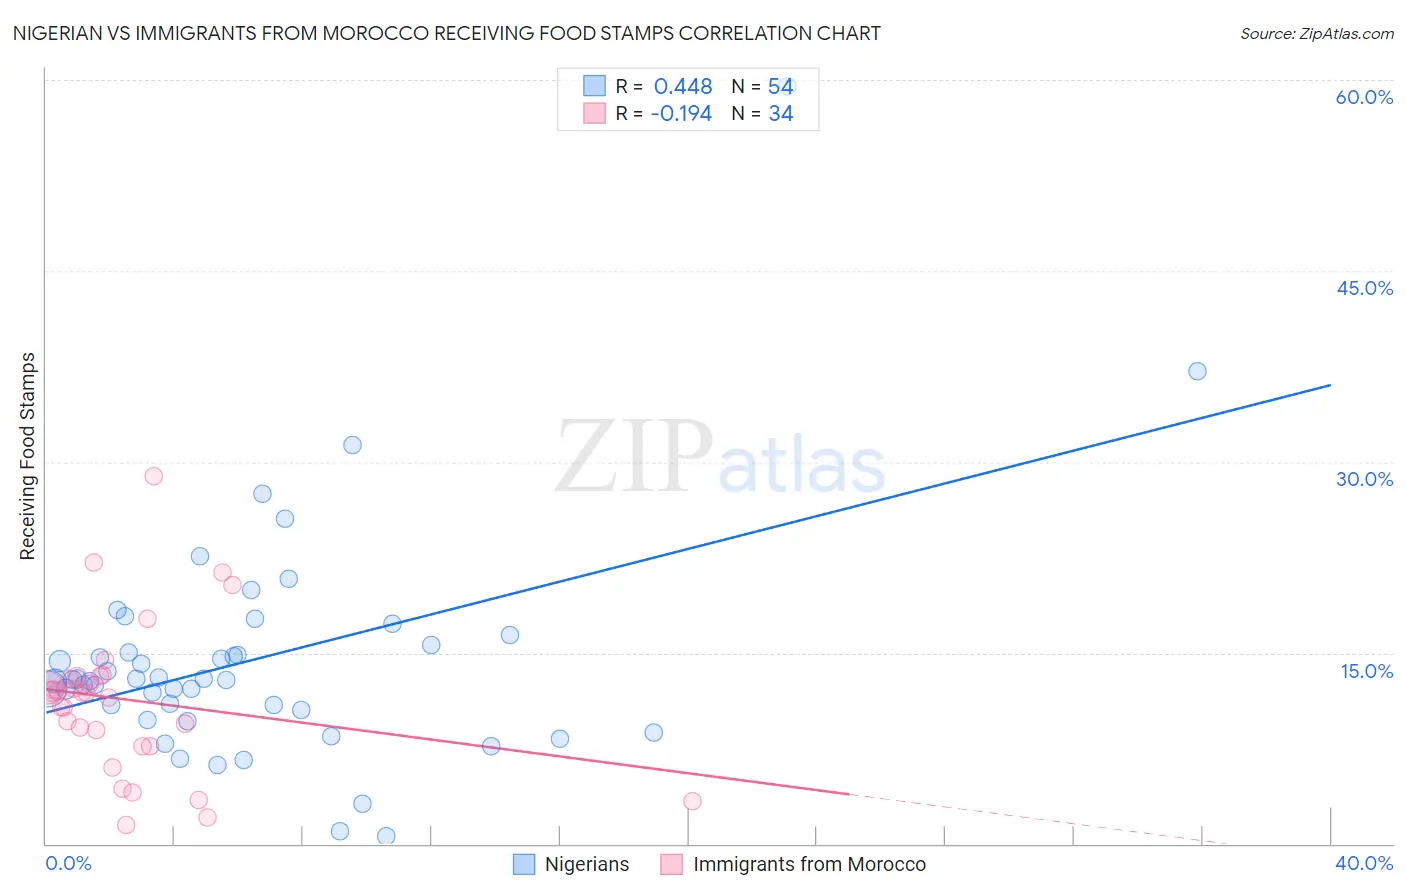
Nigerian vs Immigrants from Morocco Receiving Food Stamps Correlation Chart
The statistical analysis conducted on geographies consisting of 332,095,835 people shows a moderate positive correlation between the proportion of Nigerians and percentage of population receiving government assistance and/or food stamps in the United States with a correlation coefficient (R) of 0.448 and weighted average of 13.1%. Similarly, the statistical analysis conducted on geographies consisting of 178,818,675 people shows a poor negative correlation between the proportion of Immigrants from Morocco and percentage of population receiving government assistance and/or food stamps in the United States with a correlation coefficient (R) of -0.194 and weighted average of 11.9%, a difference of 10.2%.
Receiving Food Stamps Correlation Summary
| Measurement | Nigerian | Immigrants from Morocco |
| Minimum | 0.60% | 1.5% |
| Maximum | 59.5% | 28.9% |
| Range | 58.9% | 27.4% |
| Mean | 14.4% | 11.3% |
| Median | 12.9% | 11.9% |
| Interquartile 25% (IQ1) | 10.5% | 7.7% |
| Interquartile 75% (IQ3) | 15.6% | 13.1% |
| Interquartile Range (IQR) | 5.1% | 5.4% |
| Standard Deviation (Sample) | 9.1% | 5.9% |
| Standard Deviation (Population) | 9.0% | 5.8% |
Similar Demographics by Receiving Food Stamps
Demographics Similar to Nigerians by Receiving Food Stamps
In terms of receiving food stamps, the demographic groups most similar to Nigerians are Panamanian (13.1%, a difference of 0.010%), Ottawa (13.1%, a difference of 0.020%), Chickasaw (13.1%, a difference of 0.050%), Puget Sound Salish (13.1%, a difference of 0.070%), and Immigrants from Nigeria (13.1%, a difference of 0.11%).
| Demographics | Rating | Rank | Receiving Food Stamps |
| Immigrants | Colombia | 5.3 /100 | #220 | Tragic 12.9% |
| Bermudans | 4.8 /100 | #221 | Tragic 13.0% |
| Immigrants | Immigrants | 4.4 /100 | #222 | Tragic 13.0% |
| Immigrants | Albania | 4.4 /100 | #223 | Tragic 13.0% |
| Immigrants | Armenia | 4.3 /100 | #224 | Tragic 13.0% |
| Fijians | 4.3 /100 | #225 | Tragic 13.0% |
| Chickasaw | 3.6 /100 | #226 | Tragic 13.1% |
| Nigerians | 3.5 /100 | #227 | Tragic 13.1% |
| Panamanians | 3.5 /100 | #228 | Tragic 13.1% |
| Ottawa | 3.5 /100 | #229 | Tragic 13.1% |
| Puget Sound Salish | 3.4 /100 | #230 | Tragic 13.1% |
| Immigrants | Nigeria | 3.4 /100 | #231 | Tragic 13.1% |
| Salvadorans | 2.7 /100 | #232 | Tragic 13.2% |
| Cherokee | 2.5 /100 | #233 | Tragic 13.2% |
| Comanche | 2.4 /100 | #234 | Tragic 13.3% |
Demographics Similar to Immigrants from Morocco by Receiving Food Stamps
In terms of receiving food stamps, the demographic groups most similar to Immigrants from Morocco are Immigrants from Uganda (11.9%, a difference of 0.060%), Spaniard (11.9%, a difference of 0.13%), South American Indian (11.9%, a difference of 0.15%), Immigrants from Iraq (12.0%, a difference of 0.52%), and Spanish (12.0%, a difference of 0.56%).
| Demographics | Rating | Rank | Receiving Food Stamps |
| Osage | 49.8 /100 | #175 | Average 11.7% |
| Peruvians | 49.3 /100 | #176 | Average 11.7% |
| Immigrants | Ukraine | 48.4 /100 | #177 | Average 11.8% |
| German Russians | 48.1 /100 | #178 | Average 11.8% |
| Immigrants | Kenya | 46.4 /100 | #179 | Average 11.8% |
| Uruguayans | 44.8 /100 | #180 | Average 11.8% |
| South American Indians | 41.7 /100 | #181 | Average 11.9% |
| Immigrants | Morocco | 40.7 /100 | #182 | Average 11.9% |
| Immigrants | Uganda | 40.3 /100 | #183 | Average 11.9% |
| Spaniards | 39.8 /100 | #184 | Fair 11.9% |
| Immigrants | Iraq | 37.1 /100 | #185 | Fair 12.0% |
| Spanish | 36.9 /100 | #186 | Fair 12.0% |
| Albanians | 35.4 /100 | #187 | Fair 12.0% |
| Sudanese | 33.4 /100 | #188 | Fair 12.0% |
| Immigrants | Cameroon | 32.5 /100 | #189 | Fair 12.0% |