Immigrants from Cabo Verde vs Immigrants from North Macedonia Male Poverty
COMPARE
Immigrants from Cabo Verde
Immigrants from North Macedonia
Male Poverty
Male Poverty Comparison
Immigrants from Cabo Verde
Immigrants from North Macedonia
13.7%
MALE POVERTY
0.0/ 100
METRIC RATING
282nd/ 347
METRIC RANK
9.4%
MALE POVERTY
99.8/ 100
METRIC RATING
14th/ 347
METRIC RANK
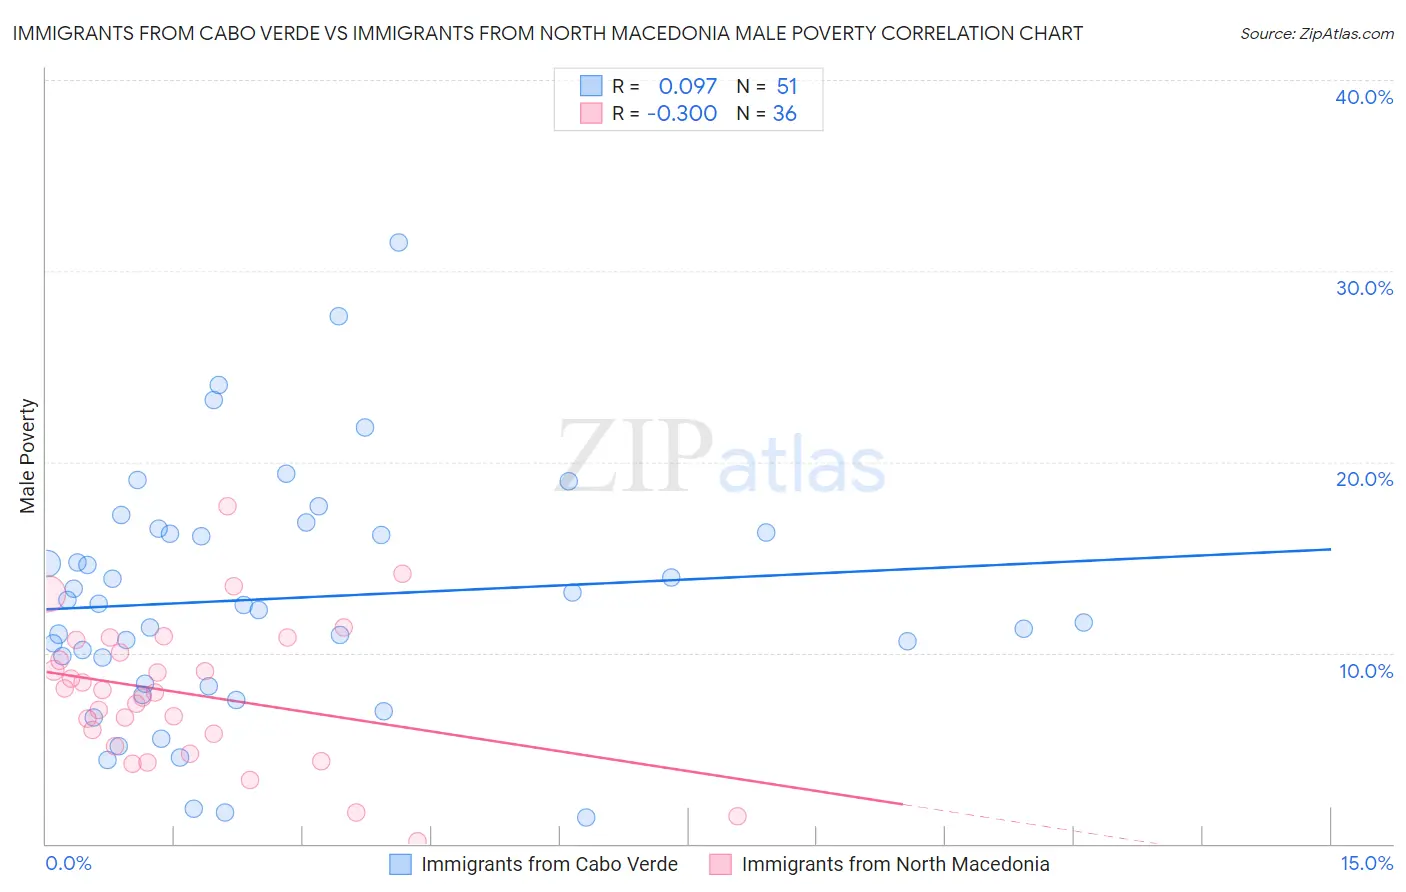
Immigrants from Cabo Verde vs Immigrants from North Macedonia Male Poverty Correlation Chart
The statistical analysis conducted on geographies consisting of 38,133,137 people shows a slight positive correlation between the proportion of Immigrants from Cabo Verde and poverty level among males in the United States with a correlation coefficient (R) of 0.097 and weighted average of 13.7%. Similarly, the statistical analysis conducted on geographies consisting of 74,289,354 people shows a weak negative correlation between the proportion of Immigrants from North Macedonia and poverty level among males in the United States with a correlation coefficient (R) of -0.300 and weighted average of 9.4%, a difference of 45.4%.
Male Poverty Correlation Summary
| Measurement | Immigrants from Cabo Verde | Immigrants from North Macedonia |
| Minimum | 1.4% | 0.15% |
| Maximum | 31.5% | 17.7% |
| Range | 30.1% | 17.6% |
| Mean | 12.8% | 7.9% |
| Median | 12.5% | 8.0% |
| Interquartile 25% (IQ1) | 8.4% | 5.4% |
| Interquartile 75% (IQ3) | 16.3% | 10.3% |
| Interquartile Range (IQR) | 7.9% | 4.9% |
| Standard Deviation (Sample) | 6.3% | 3.7% |
| Standard Deviation (Population) | 6.2% | 3.7% |
Similar Demographics by Male Poverty
Demographics Similar to Immigrants from Cabo Verde by Male Poverty
In terms of male poverty, the demographic groups most similar to Immigrants from Cabo Verde are Comanche (13.8%, a difference of 0.20%), Immigrants from Haiti (13.8%, a difference of 0.21%), West Indian (13.8%, a difference of 0.23%), Shoshone (13.8%, a difference of 0.26%), and Yaqui (13.7%, a difference of 0.27%).
| Demographics | Rating | Rank | Male Poverty |
| Barbadians | 0.0 /100 | #275 | Tragic 13.6% |
| Immigrants | Latin America | 0.0 /100 | #276 | Tragic 13.6% |
| Bangladeshis | 0.0 /100 | #277 | Tragic 13.6% |
| Belizeans | 0.0 /100 | #278 | Tragic 13.6% |
| Haitians | 0.0 /100 | #279 | Tragic 13.7% |
| Mexicans | 0.0 /100 | #280 | Tragic 13.7% |
| Yaqui | 0.0 /100 | #281 | Tragic 13.7% |
| Immigrants | Cabo Verde | 0.0 /100 | #282 | Tragic 13.7% |
| Comanche | 0.0 /100 | #283 | Tragic 13.8% |
| Immigrants | Haiti | 0.0 /100 | #284 | Tragic 13.8% |
| West Indians | 0.0 /100 | #285 | Tragic 13.8% |
| Shoshone | 0.0 /100 | #286 | Tragic 13.8% |
| Immigrants | Barbados | 0.0 /100 | #287 | Tragic 13.8% |
| Immigrants | St. Vincent and the Grenadines | 0.0 /100 | #288 | Tragic 13.8% |
| Guatemalans | 0.0 /100 | #289 | Tragic 13.8% |
Demographics Similar to Immigrants from North Macedonia by Male Poverty
In terms of male poverty, the demographic groups most similar to Immigrants from North Macedonia are Bhutanese (9.5%, a difference of 0.29%), Immigrants from Lithuania (9.4%, a difference of 0.38%), Immigrants from Bolivia (9.4%, a difference of 0.50%), Bolivian (9.4%, a difference of 0.56%), and Luxembourger (9.5%, a difference of 0.81%).
| Demographics | Rating | Rank | Male Poverty |
| Immigrants | Ireland | 99.9 /100 | #7 | Exceptional 9.1% |
| Filipinos | 99.9 /100 | #8 | Exceptional 9.2% |
| Immigrants | South Central Asia | 99.9 /100 | #9 | Exceptional 9.3% |
| Bulgarians | 99.9 /100 | #10 | Exceptional 9.3% |
| Bolivians | 99.9 /100 | #11 | Exceptional 9.4% |
| Immigrants | Bolivia | 99.9 /100 | #12 | Exceptional 9.4% |
| Immigrants | Lithuania | 99.9 /100 | #13 | Exceptional 9.4% |
| Immigrants | North Macedonia | 99.8 /100 | #14 | Exceptional 9.4% |
| Bhutanese | 99.8 /100 | #15 | Exceptional 9.5% |
| Luxembourgers | 99.8 /100 | #16 | Exceptional 9.5% |
| Norwegians | 99.8 /100 | #17 | Exceptional 9.5% |
| Lithuanians | 99.8 /100 | #18 | Exceptional 9.5% |
| Immigrants | Hong Kong | 99.7 /100 | #19 | Exceptional 9.6% |
| Latvians | 99.7 /100 | #20 | Exceptional 9.6% |
| Immigrants | Scotland | 99.7 /100 | #21 | Exceptional 9.6% |