Immigrants from Cabo Verde vs Immigrants from Chile Male Poverty
COMPARE
Immigrants from Cabo Verde
Immigrants from Chile
Male Poverty
Male Poverty Comparison
Immigrants from Cabo Verde
Immigrants from Chile
13.7%
MALE POVERTY
0.0/ 100
METRIC RATING
282nd/ 347
METRIC RANK
11.1%
MALE POVERTY
57.4/ 100
METRIC RATING
162nd/ 347
METRIC RANK
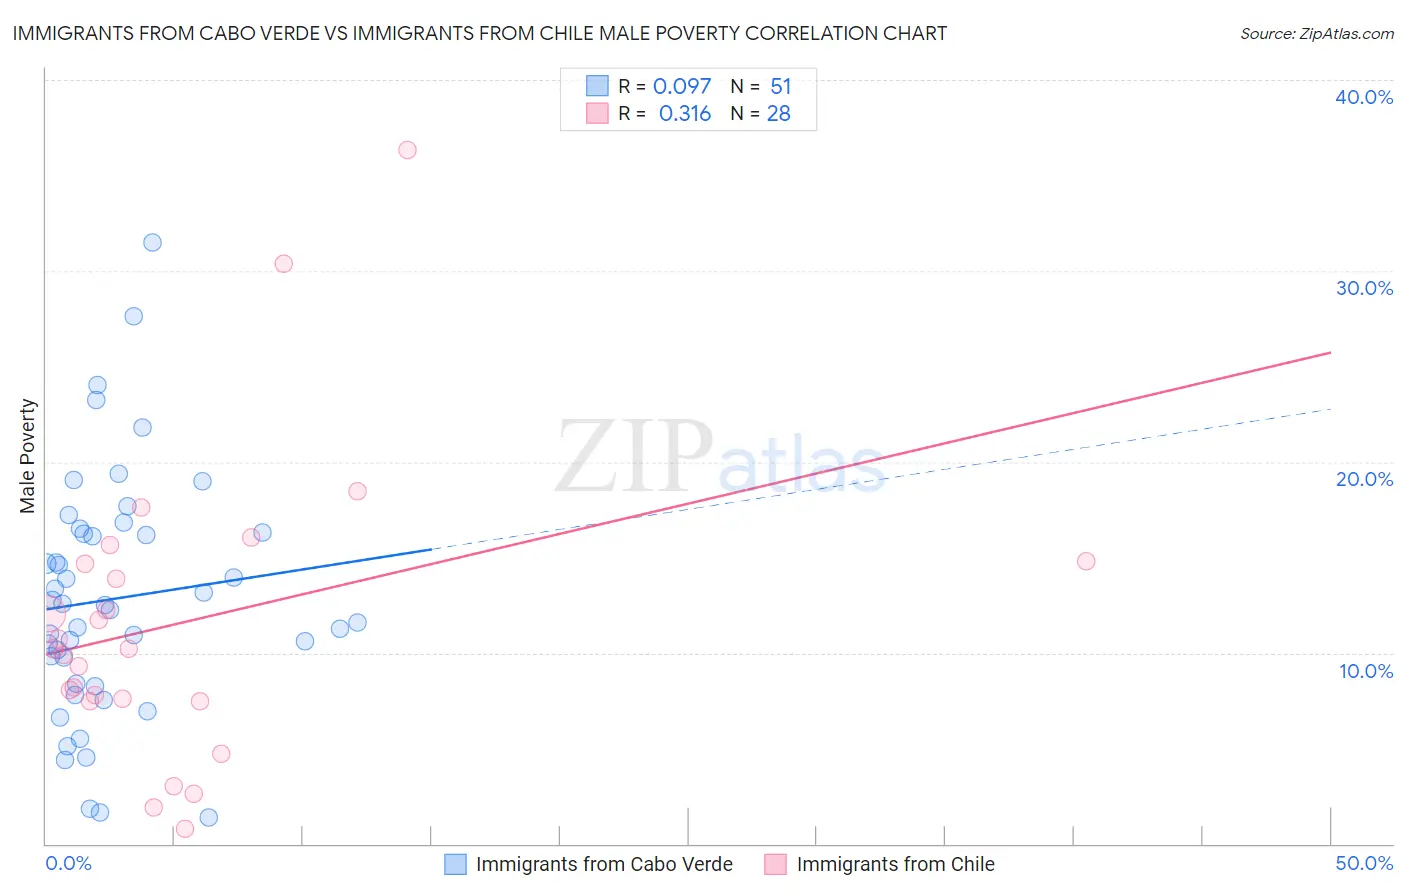
Immigrants from Cabo Verde vs Immigrants from Chile Male Poverty Correlation Chart
The statistical analysis conducted on geographies consisting of 38,133,137 people shows a slight positive correlation between the proportion of Immigrants from Cabo Verde and poverty level among males in the United States with a correlation coefficient (R) of 0.097 and weighted average of 13.7%. Similarly, the statistical analysis conducted on geographies consisting of 218,566,097 people shows a mild positive correlation between the proportion of Immigrants from Chile and poverty level among males in the United States with a correlation coefficient (R) of 0.316 and weighted average of 11.1%, a difference of 23.6%.
Male Poverty Correlation Summary
| Measurement | Immigrants from Cabo Verde | Immigrants from Chile |
| Minimum | 1.4% | 0.80% |
| Maximum | 31.5% | 36.4% |
| Range | 30.1% | 35.6% |
| Mean | 12.8% | 11.6% |
| Median | 12.5% | 10.2% |
| Interquartile 25% (IQ1) | 8.4% | 7.5% |
| Interquartile 75% (IQ3) | 16.3% | 14.8% |
| Interquartile Range (IQR) | 7.9% | 7.2% |
| Standard Deviation (Sample) | 6.3% | 7.8% |
| Standard Deviation (Population) | 6.2% | 7.6% |
Similar Demographics by Male Poverty
Demographics Similar to Immigrants from Cabo Verde by Male Poverty
In terms of male poverty, the demographic groups most similar to Immigrants from Cabo Verde are Comanche (13.8%, a difference of 0.20%), Immigrants from Haiti (13.8%, a difference of 0.21%), West Indian (13.8%, a difference of 0.23%), Shoshone (13.8%, a difference of 0.26%), and Yaqui (13.7%, a difference of 0.27%).
| Demographics | Rating | Rank | Male Poverty |
| Barbadians | 0.0 /100 | #275 | Tragic 13.6% |
| Immigrants | Latin America | 0.0 /100 | #276 | Tragic 13.6% |
| Bangladeshis | 0.0 /100 | #277 | Tragic 13.6% |
| Belizeans | 0.0 /100 | #278 | Tragic 13.6% |
| Haitians | 0.0 /100 | #279 | Tragic 13.7% |
| Mexicans | 0.0 /100 | #280 | Tragic 13.7% |
| Yaqui | 0.0 /100 | #281 | Tragic 13.7% |
| Immigrants | Cabo Verde | 0.0 /100 | #282 | Tragic 13.7% |
| Comanche | 0.0 /100 | #283 | Tragic 13.8% |
| Immigrants | Haiti | 0.0 /100 | #284 | Tragic 13.8% |
| West Indians | 0.0 /100 | #285 | Tragic 13.8% |
| Shoshone | 0.0 /100 | #286 | Tragic 13.8% |
| Immigrants | Barbados | 0.0 /100 | #287 | Tragic 13.8% |
| Immigrants | St. Vincent and the Grenadines | 0.0 /100 | #288 | Tragic 13.8% |
| Guatemalans | 0.0 /100 | #289 | Tragic 13.8% |
Demographics Similar to Immigrants from Chile by Male Poverty
In terms of male poverty, the demographic groups most similar to Immigrants from Chile are White/Caucasian (11.1%, a difference of 0.060%), Ethiopian (11.1%, a difference of 0.070%), Immigrants from Spain (11.1%, a difference of 0.19%), Immigrants from Albania (11.1%, a difference of 0.21%), and Hungarian (11.1%, a difference of 0.22%).
| Demographics | Rating | Rank | Male Poverty |
| Immigrants | Malaysia | 64.7 /100 | #155 | Good 11.0% |
| Costa Ricans | 63.9 /100 | #156 | Good 11.0% |
| Scotch-Irish | 63.7 /100 | #157 | Good 11.0% |
| Colombians | 63.0 /100 | #158 | Good 11.0% |
| Taiwanese | 62.7 /100 | #159 | Good 11.0% |
| Soviet Union | 60.3 /100 | #160 | Good 11.1% |
| Immigrants | Northern Africa | 59.7 /100 | #161 | Average 11.1% |
| Immigrants | Chile | 57.4 /100 | #162 | Average 11.1% |
| Whites/Caucasians | 56.7 /100 | #163 | Average 11.1% |
| Ethiopians | 56.7 /100 | #164 | Average 11.1% |
| Immigrants | Spain | 55.5 /100 | #165 | Average 11.1% |
| Immigrants | Albania | 55.3 /100 | #166 | Average 11.1% |
| Hungarians | 55.1 /100 | #167 | Average 11.1% |
| Immigrants | Portugal | 54.9 /100 | #168 | Average 11.1% |
| Immigrants | Colombia | 54.2 /100 | #169 | Average 11.1% |