Immigrants from Cabo Verde vs Burmese Male Poverty
COMPARE
Immigrants from Cabo Verde
Burmese
Male Poverty
Male Poverty Comparison
Immigrants from Cabo Verde
Burmese
13.7%
MALE POVERTY
0.0/ 100
METRIC RATING
282nd/ 347
METRIC RANK
9.7%
MALE POVERTY
99.6/ 100
METRIC RATING
26th/ 347
METRIC RANK
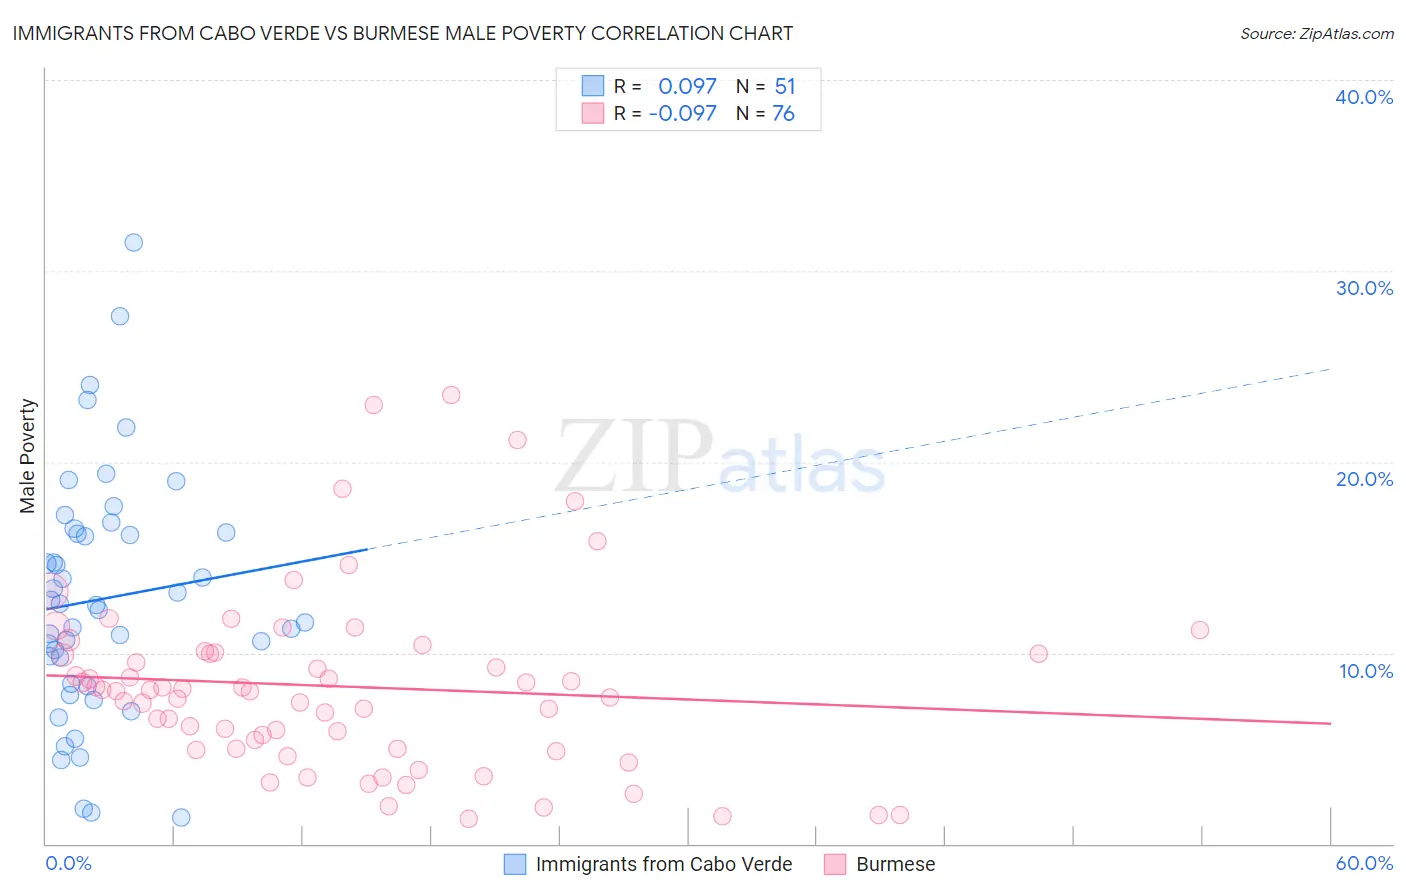
Immigrants from Cabo Verde vs Burmese Male Poverty Correlation Chart
The statistical analysis conducted on geographies consisting of 38,133,137 people shows a slight positive correlation between the proportion of Immigrants from Cabo Verde and poverty level among males in the United States with a correlation coefficient (R) of 0.097 and weighted average of 13.7%. Similarly, the statistical analysis conducted on geographies consisting of 464,653,022 people shows a slight negative correlation between the proportion of Burmese and poverty level among males in the United States with a correlation coefficient (R) of -0.097 and weighted average of 9.7%, a difference of 41.7%.
Male Poverty Correlation Summary
| Measurement | Immigrants from Cabo Verde | Burmese |
| Minimum | 1.4% | 1.3% |
| Maximum | 31.5% | 23.5% |
| Range | 30.1% | 22.2% |
| Mean | 12.8% | 8.2% |
| Median | 12.5% | 8.0% |
| Interquartile 25% (IQ1) | 8.4% | 5.0% |
| Interquartile 75% (IQ3) | 16.3% | 10.0% |
| Interquartile Range (IQR) | 7.9% | 5.1% |
| Standard Deviation (Sample) | 6.3% | 4.7% |
| Standard Deviation (Population) | 6.2% | 4.7% |
Similar Demographics by Male Poverty
Demographics Similar to Immigrants from Cabo Verde by Male Poverty
In terms of male poverty, the demographic groups most similar to Immigrants from Cabo Verde are Comanche (13.8%, a difference of 0.20%), Immigrants from Haiti (13.8%, a difference of 0.21%), West Indian (13.8%, a difference of 0.23%), Shoshone (13.8%, a difference of 0.26%), and Yaqui (13.7%, a difference of 0.27%).
| Demographics | Rating | Rank | Male Poverty |
| Barbadians | 0.0 /100 | #275 | Tragic 13.6% |
| Immigrants | Latin America | 0.0 /100 | #276 | Tragic 13.6% |
| Bangladeshis | 0.0 /100 | #277 | Tragic 13.6% |
| Belizeans | 0.0 /100 | #278 | Tragic 13.6% |
| Haitians | 0.0 /100 | #279 | Tragic 13.7% |
| Mexicans | 0.0 /100 | #280 | Tragic 13.7% |
| Yaqui | 0.0 /100 | #281 | Tragic 13.7% |
| Immigrants | Cabo Verde | 0.0 /100 | #282 | Tragic 13.7% |
| Comanche | 0.0 /100 | #283 | Tragic 13.8% |
| Immigrants | Haiti | 0.0 /100 | #284 | Tragic 13.8% |
| West Indians | 0.0 /100 | #285 | Tragic 13.8% |
| Shoshone | 0.0 /100 | #286 | Tragic 13.8% |
| Immigrants | Barbados | 0.0 /100 | #287 | Tragic 13.8% |
| Immigrants | St. Vincent and the Grenadines | 0.0 /100 | #288 | Tragic 13.8% |
| Guatemalans | 0.0 /100 | #289 | Tragic 13.8% |
Demographics Similar to Burmese by Male Poverty
In terms of male poverty, the demographic groups most similar to Burmese are Danish (9.7%, a difference of 0.13%), Immigrants from Korea (9.7%, a difference of 0.21%), Greek (9.7%, a difference of 0.25%), Polish (9.7%, a difference of 0.33%), and Tongan (9.7%, a difference of 0.35%).
| Demographics | Rating | Rank | Male Poverty |
| Immigrants | Hong Kong | 99.7 /100 | #19 | Exceptional 9.6% |
| Latvians | 99.7 /100 | #20 | Exceptional 9.6% |
| Immigrants | Scotland | 99.7 /100 | #21 | Exceptional 9.6% |
| Croatians | 99.7 /100 | #22 | Exceptional 9.6% |
| Italians | 99.7 /100 | #23 | Exceptional 9.6% |
| Swedes | 99.7 /100 | #24 | Exceptional 9.6% |
| Eastern Europeans | 99.6 /100 | #25 | Exceptional 9.6% |
| Burmese | 99.6 /100 | #26 | Exceptional 9.7% |
| Danes | 99.6 /100 | #27 | Exceptional 9.7% |
| Immigrants | Korea | 99.6 /100 | #28 | Exceptional 9.7% |
| Greeks | 99.6 /100 | #29 | Exceptional 9.7% |
| Poles | 99.5 /100 | #30 | Exceptional 9.7% |
| Tongans | 99.5 /100 | #31 | Exceptional 9.7% |
| Macedonians | 99.5 /100 | #32 | Exceptional 9.7% |
| Immigrants | Northern Europe | 99.5 /100 | #33 | Exceptional 9.7% |