Immigrants from Nigeria vs Celtic Receiving Food Stamps
COMPARE
Immigrants from Nigeria
Celtic
Receiving Food Stamps
Receiving Food Stamps Comparison
Immigrants from Nigeria
Celtics
13.1%
RECEIVING FOOD STAMPS
3.4/ 100
METRIC RATING
231st/ 347
METRIC RANK
10.9%
RECEIVING FOOD STAMPS
87.8/ 100
METRIC RATING
140th/ 347
METRIC RANK
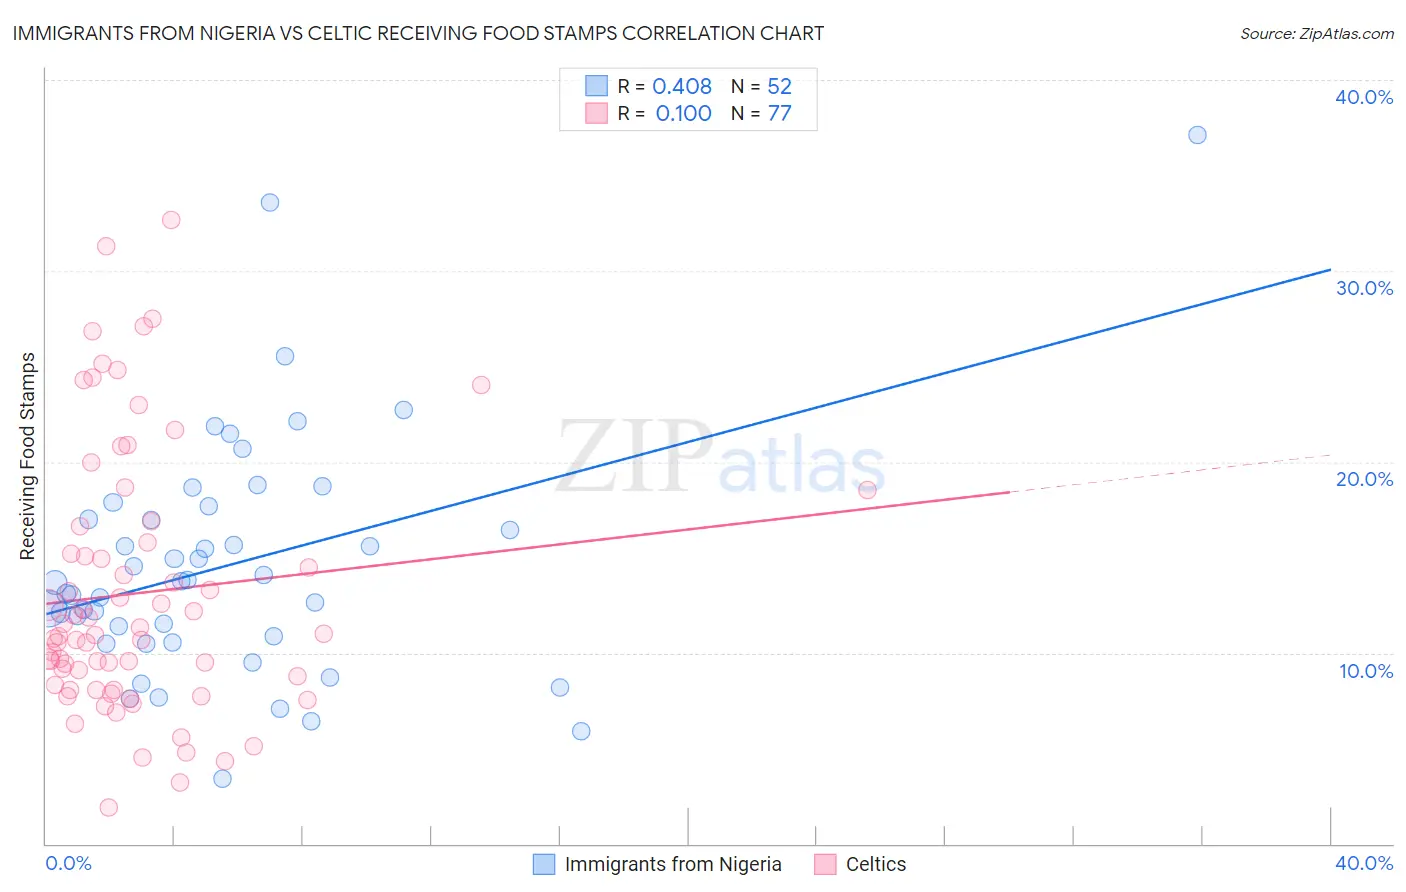
Immigrants from Nigeria vs Celtic Receiving Food Stamps Correlation Chart
The statistical analysis conducted on geographies consisting of 282,993,216 people shows a moderate positive correlation between the proportion of Immigrants from Nigeria and percentage of population receiving government assistance and/or food stamps in the United States with a correlation coefficient (R) of 0.408 and weighted average of 13.1%. Similarly, the statistical analysis conducted on geographies consisting of 168,687,125 people shows a slight positive correlation between the proportion of Celtics and percentage of population receiving government assistance and/or food stamps in the United States with a correlation coefficient (R) of 0.100 and weighted average of 10.9%, a difference of 20.0%.
Receiving Food Stamps Correlation Summary
| Measurement | Immigrants from Nigeria | Celtic |
| Minimum | 3.4% | 1.9% |
| Maximum | 37.1% | 32.7% |
| Range | 33.7% | 30.8% |
| Mean | 14.6% | 13.1% |
| Median | 13.7% | 11.0% |
| Interquartile 25% (IQ1) | 10.7% | 8.2% |
| Interquartile 75% (IQ3) | 17.3% | 16.2% |
| Interquartile Range (IQR) | 6.6% | 8.0% |
| Standard Deviation (Sample) | 6.3% | 6.9% |
| Standard Deviation (Population) | 6.2% | 6.8% |
Similar Demographics by Receiving Food Stamps
Demographics Similar to Immigrants from Nigeria by Receiving Food Stamps
In terms of receiving food stamps, the demographic groups most similar to Immigrants from Nigeria are Puget Sound Salish (13.1%, a difference of 0.040%), Ottawa (13.1%, a difference of 0.090%), Panamanian (13.1%, a difference of 0.10%), Nigerian (13.1%, a difference of 0.11%), and Chickasaw (13.1%, a difference of 0.15%).
| Demographics | Rating | Rank | Receiving Food Stamps |
| Immigrants | Armenia | 4.3 /100 | #224 | Tragic 13.0% |
| Fijians | 4.3 /100 | #225 | Tragic 13.0% |
| Chickasaw | 3.6 /100 | #226 | Tragic 13.1% |
| Nigerians | 3.5 /100 | #227 | Tragic 13.1% |
| Panamanians | 3.5 /100 | #228 | Tragic 13.1% |
| Ottawa | 3.5 /100 | #229 | Tragic 13.1% |
| Puget Sound Salish | 3.4 /100 | #230 | Tragic 13.1% |
| Immigrants | Nigeria | 3.4 /100 | #231 | Tragic 13.1% |
| Salvadorans | 2.7 /100 | #232 | Tragic 13.2% |
| Cherokee | 2.5 /100 | #233 | Tragic 13.2% |
| Comanche | 2.4 /100 | #234 | Tragic 13.3% |
| Immigrants | Zaire | 1.9 /100 | #235 | Tragic 13.4% |
| Crow | 1.6 /100 | #236 | Tragic 13.4% |
| Immigrants | El Salvador | 1.5 /100 | #237 | Tragic 13.5% |
| French American Indians | 1.4 /100 | #238 | Tragic 13.5% |
Demographics Similar to Celtics by Receiving Food Stamps
In terms of receiving food stamps, the demographic groups most similar to Celtics are Hmong (10.9%, a difference of 0.20%), Immigrants from Moldova (10.9%, a difference of 0.24%), Immigrants from Vietnam (11.0%, a difference of 0.36%), Chilean (11.0%, a difference of 0.53%), and Immigrants from Northern Africa (11.0%, a difference of 0.61%).
| Demographics | Rating | Rank | Receiving Food Stamps |
| Immigrants | Russia | 90.9 /100 | #133 | Exceptional 10.8% |
| Immigrants | Brazil | 90.3 /100 | #134 | Exceptional 10.8% |
| Argentineans | 90.2 /100 | #135 | Exceptional 10.8% |
| Slovaks | 89.8 /100 | #136 | Excellent 10.8% |
| Immigrants | Eastern Europe | 89.8 /100 | #137 | Excellent 10.8% |
| Immigrants | Moldova | 88.5 /100 | #138 | Excellent 10.9% |
| Hmong | 88.4 /100 | #139 | Excellent 10.9% |
| Celtics | 87.8 /100 | #140 | Excellent 10.9% |
| Immigrants | Vietnam | 86.7 /100 | #141 | Excellent 11.0% |
| Chileans | 86.2 /100 | #142 | Excellent 11.0% |
| Immigrants | Northern Africa | 86.0 /100 | #143 | Excellent 11.0% |
| Syrians | 85.5 /100 | #144 | Excellent 11.0% |
| Hungarians | 85.1 /100 | #145 | Excellent 11.0% |
| Taiwanese | 84.2 /100 | #146 | Excellent 11.0% |
| Whites/Caucasians | 83.9 /100 | #147 | Excellent 11.1% |