Immigrants from Argentina vs Celtic Receiving Food Stamps
COMPARE
Immigrants from Argentina
Celtic
Receiving Food Stamps
Receiving Food Stamps Comparison
Immigrants from Argentina
Celtics
11.2%
RECEIVING FOOD STAMPS
80.4/ 100
METRIC RATING
155th/ 347
METRIC RANK
10.9%
RECEIVING FOOD STAMPS
87.8/ 100
METRIC RATING
140th/ 347
METRIC RANK
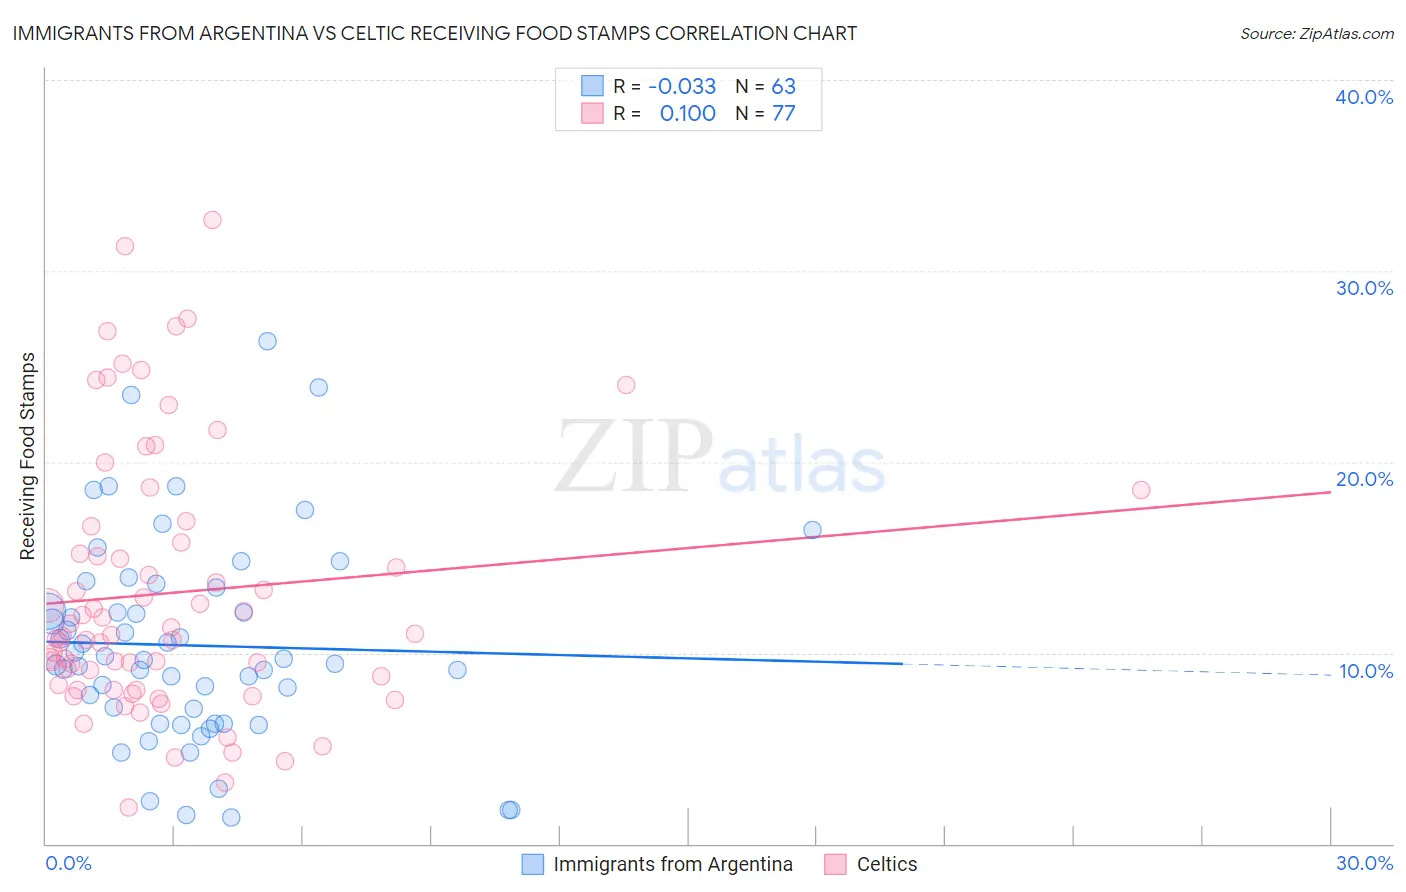
Immigrants from Argentina vs Celtic Receiving Food Stamps Correlation Chart
The statistical analysis conducted on geographies consisting of 263,859,241 people shows no correlation between the proportion of Immigrants from Argentina and percentage of population receiving government assistance and/or food stamps in the United States with a correlation coefficient (R) of -0.033 and weighted average of 11.2%. Similarly, the statistical analysis conducted on geographies consisting of 168,687,125 people shows a slight positive correlation between the proportion of Celtics and percentage of population receiving government assistance and/or food stamps in the United States with a correlation coefficient (R) of 0.100 and weighted average of 10.9%, a difference of 2.1%.
Receiving Food Stamps Correlation Summary
| Measurement | Immigrants from Argentina | Celtic |
| Minimum | 1.4% | 1.9% |
| Maximum | 26.3% | 32.7% |
| Range | 24.9% | 30.8% |
| Mean | 10.4% | 13.1% |
| Median | 9.6% | 11.0% |
| Interquartile 25% (IQ1) | 6.3% | 8.2% |
| Interquartile 75% (IQ3) | 13.4% | 16.2% |
| Interquartile Range (IQR) | 7.1% | 8.0% |
| Standard Deviation (Sample) | 5.3% | 6.9% |
| Standard Deviation (Population) | 5.3% | 6.8% |
Demographics Similar to Immigrants from Argentina and Celtics by Receiving Food Stamps
In terms of receiving food stamps, the demographic groups most similar to Immigrants from Argentina are Armenian (11.1%, a difference of 0.25%), Lebanese (11.1%, a difference of 0.31%), Immigrants from Spain (11.1%, a difference of 0.33%), Immigrants from Kazakhstan (11.1%, a difference of 0.33%), and Soviet Union (11.1%, a difference of 0.69%). Similarly, the demographic groups most similar to Celtics are Hmong (10.9%, a difference of 0.20%), Immigrants from Moldova (10.9%, a difference of 0.24%), Immigrants from Vietnam (11.0%, a difference of 0.36%), Chilean (11.0%, a difference of 0.53%), and Immigrants from Northern Africa (11.0%, a difference of 0.61%).
| Demographics | Rating | Rank | Receiving Food Stamps |
| Immigrants | Eastern Europe | 89.8 /100 | #137 | Excellent 10.8% |
| Immigrants | Moldova | 88.5 /100 | #138 | Excellent 10.9% |
| Hmong | 88.4 /100 | #139 | Excellent 10.9% |
| Celtics | 87.8 /100 | #140 | Excellent 10.9% |
| Immigrants | Vietnam | 86.7 /100 | #141 | Excellent 11.0% |
| Chileans | 86.2 /100 | #142 | Excellent 11.0% |
| Immigrants | Northern Africa | 86.0 /100 | #143 | Excellent 11.0% |
| Syrians | 85.5 /100 | #144 | Excellent 11.0% |
| Hungarians | 85.1 /100 | #145 | Excellent 11.0% |
| Taiwanese | 84.2 /100 | #146 | Excellent 11.0% |
| Whites/Caucasians | 83.9 /100 | #147 | Excellent 11.1% |
| Immigrants | South Eastern Asia | 83.3 /100 | #148 | Excellent 11.1% |
| Brazilians | 83.2 /100 | #149 | Excellent 11.1% |
| Soviet Union | 83.1 /100 | #150 | Excellent 11.1% |
| Immigrants | Spain | 81.7 /100 | #151 | Excellent 11.1% |
| Immigrants | Kazakhstan | 81.7 /100 | #152 | Excellent 11.1% |
| Lebanese | 81.6 /100 | #153 | Excellent 11.1% |
| Armenians | 81.4 /100 | #154 | Excellent 11.1% |
| Immigrants | Argentina | 80.4 /100 | #155 | Excellent 11.2% |
| Immigrants | Afghanistan | 75.6 /100 | #156 | Good 11.3% |
| Immigrants | Lebanon | 75.2 /100 | #157 | Good 11.3% |